Fig. 1
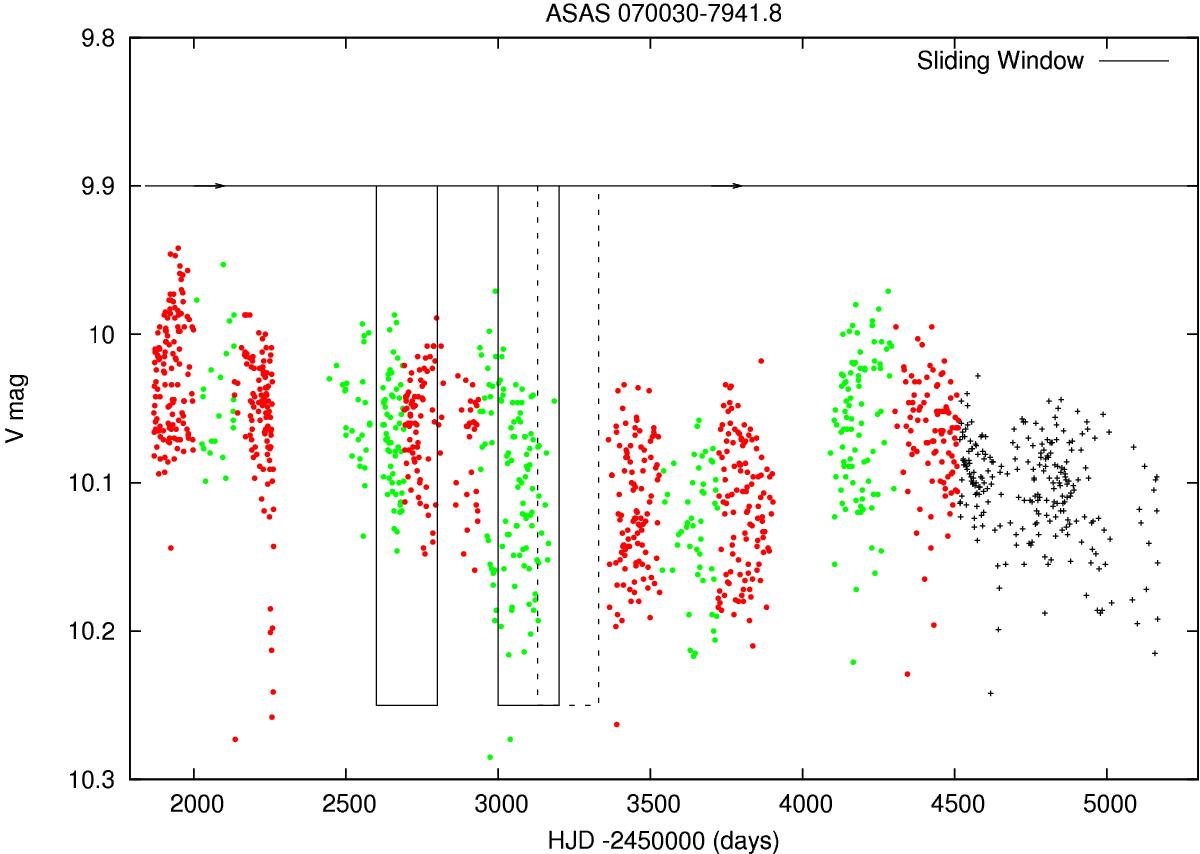
Typical V-band time series collected by the ASAS survey. The red and green bullets mark the segmentation performed by Messina et al. (2010). The black continuous boxes depict two of the extracted segments, while the dotted box indicates one of the sub-series rejected by our segmentation algorithm. The black crosses mark data that have not been processed in Messina et al. (2010). We employed a 50-day sliding window, while in the plot we sketch a 200-day sliding window for clarity.
Current usage metrics show cumulative count of Article Views (full-text article views including HTML views, PDF and ePub downloads, according to the available data) and Abstracts Views on Vision4Press platform.
Data correspond to usage on the plateform after 2015. The current usage metrics is available 48-96 hours after online publication and is updated daily on week days.
Initial download of the metrics may take a while.