Fig. 6
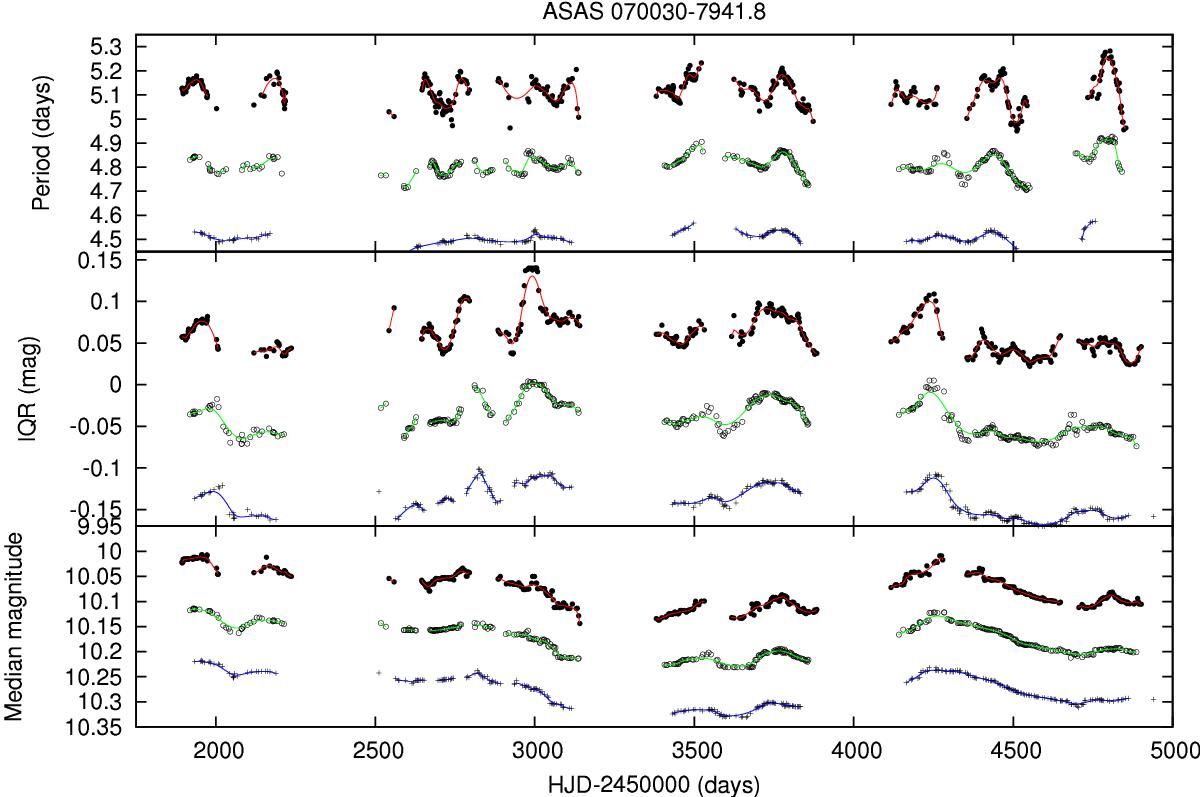
Output of our analysis for ASAS ID J070030-7941.8. The filled circles, empty circles, and crosses show the results obtained with 50-d, 100-d, and 150-d sliding windows, respectively. The results obtained with the 100-d and 150-d sliding window have been vertically shifted to make the plot clearer. Top panel: rotation periods found in the different segments vs. time. Each point is located at the mid-time of the corresponding segment. Middle panel: IQR measured in the different segments vs. time. Bottom panel: median magnitude vs. time. The solid lines were obtained by fitting the data with smoothing cubic splines.
Current usage metrics show cumulative count of Article Views (full-text article views including HTML views, PDF and ePub downloads, according to the available data) and Abstracts Views on Vision4Press platform.
Data correspond to usage on the plateform after 2015. The current usage metrics is available 48-96 hours after online publication and is updated daily on week days.
Initial download of the metrics may take a while.