Fig. 4
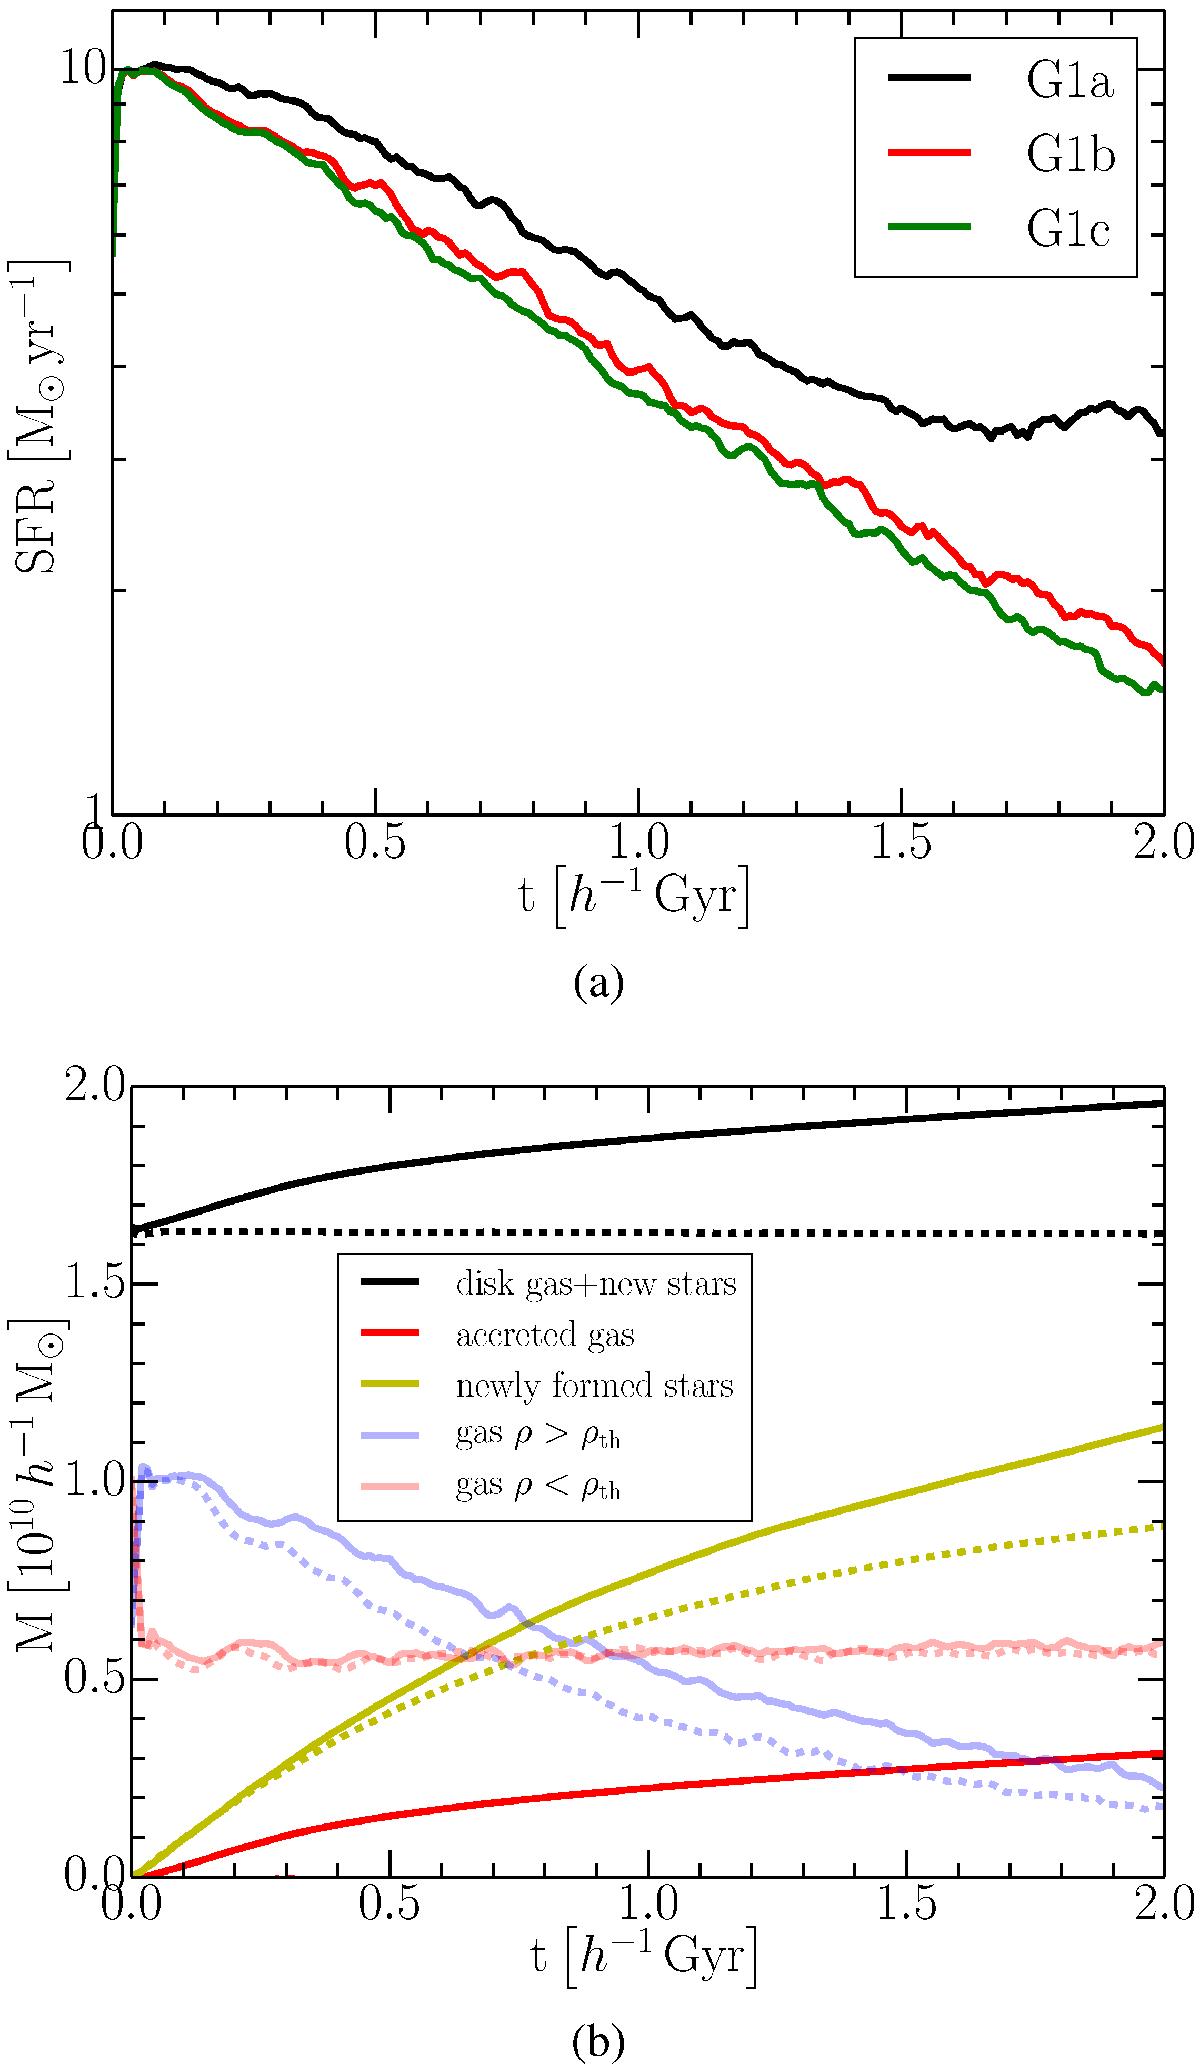
a) Star formation rate of model galaxy G1 when evolved in isolation. The three variants shown correspond to different gas masses in the corona. Model G1a has the same baryonic mass in the halo as in the disk, G1b has half of that mass, and G1c has only 1% of the disk mass in the gaseous halo. b) Evolution of different baryonic components of galaxy model G1a (solid lines) and G1c (dashed lines) evolved in isolation. The red line indicates accreted halo mass onto the disk. The mass components shown are newly formed stars, star-forming (ρ> 2.6 h2 cm-3), and non-star-forming gas. The black line shows the total gas mass in the disk plus newly formed stars.
Current usage metrics show cumulative count of Article Views (full-text article views including HTML views, PDF and ePub downloads, according to the available data) and Abstracts Views on Vision4Press platform.
Data correspond to usage on the plateform after 2015. The current usage metrics is available 48-96 hours after online publication and is updated daily on week days.
Initial download of the metrics may take a while.