Fig. 1
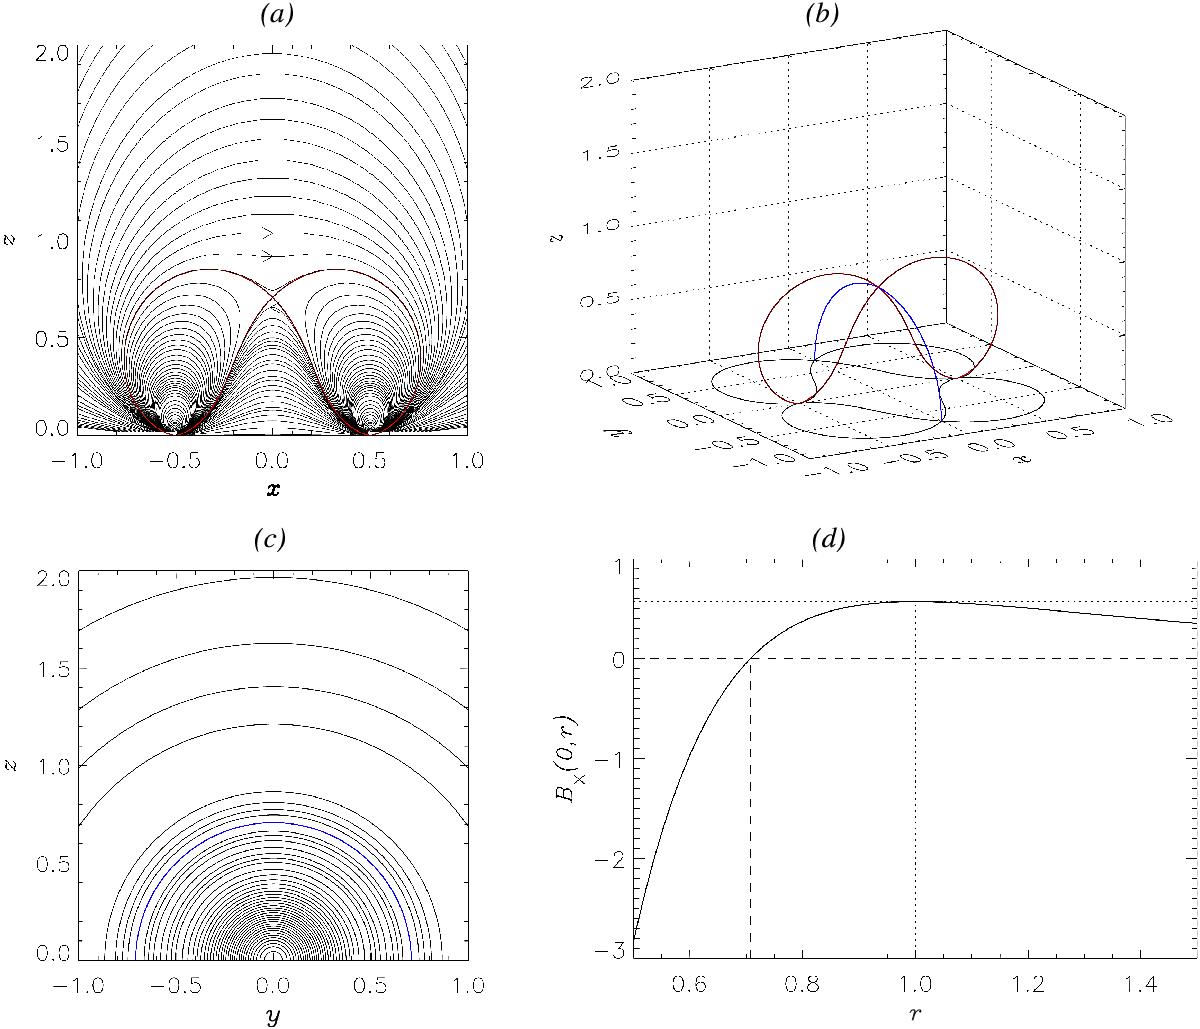
a) Equilibrium magnetic field in the y = 0, xz-plane. Dipoles are located at x = ± 0.5. X-point is located at x = 0 and ![]() . Red lines indicate the separatrices in this plane. b) 3D visualisation of the equilibrium magnetic field denoting the red separatrices along y = 0 from a) and perpendicular to this the blue X-line along x = 0 from c). Equilibrium magnetic field is rotationally symmetric about the y = 0 axis and thus black curves denote the separatrices in the xy-plane at z = 0. c) Equilibrium magnetic field shown in the x = 0, yz-plane. Magnetic field is only in the x-direction, hence no arrows. Blue line denotes the X-line of the form y2 + z2 = 2a2. d) Plot of Bx(0,r) where r2 = y2 + z2. Bx(0,r) changes sign at
. Red lines indicate the separatrices in this plane. b) 3D visualisation of the equilibrium magnetic field denoting the red separatrices along y = 0 from a) and perpendicular to this the blue X-line along x = 0 from c). Equilibrium magnetic field is rotationally symmetric about the y = 0 axis and thus black curves denote the separatrices in the xy-plane at z = 0. c) Equilibrium magnetic field shown in the x = 0, yz-plane. Magnetic field is only in the x-direction, hence no arrows. Blue line denotes the X-line of the form y2 + z2 = 2a2. d) Plot of Bx(0,r) where r2 = y2 + z2. Bx(0,r) changes sign at ![]() , i.e. at location of the X-line. Maximum of dBx(0,r)/dr occurs at r = 1, where Bx(0,r = 1) = (4/5)5/2 = 0.5724.
, i.e. at location of the X-line. Maximum of dBx(0,r)/dr occurs at r = 1, where Bx(0,r = 1) = (4/5)5/2 = 0.5724.
Current usage metrics show cumulative count of Article Views (full-text article views including HTML views, PDF and ePub downloads, according to the available data) and Abstracts Views on Vision4Press platform.
Data correspond to usage on the plateform after 2015. The current usage metrics is available 48-96 hours after online publication and is updated daily on week days.
Initial download of the metrics may take a while.