Fig. 2
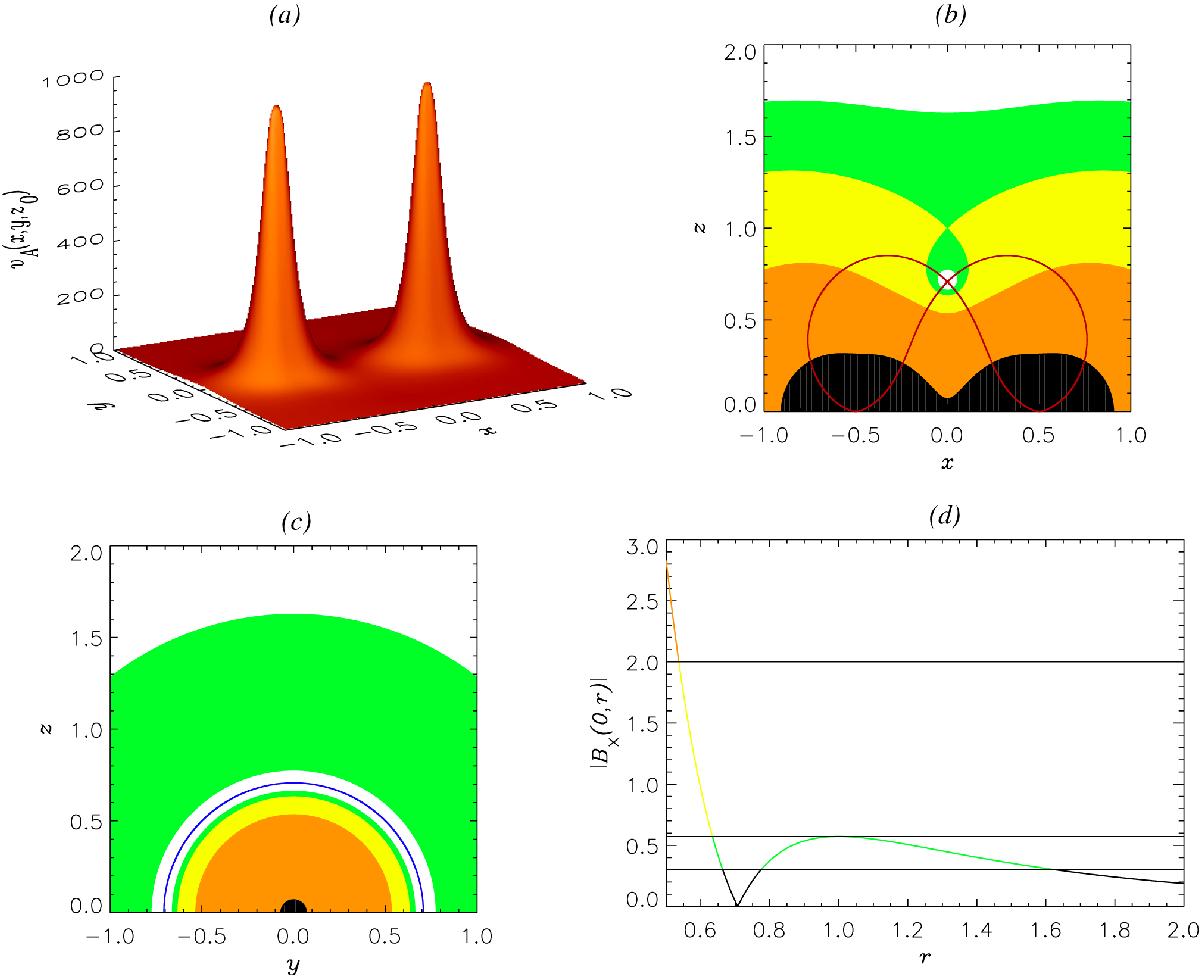
a) Shaded surface of vA(x,y,z0) = | B0(x,y,z0) | in the xy-plane at z0 = 0.1, with local maxima at (x,y,z) = ( ± a,0,0), i.e. the dipoles’ location. b) Colour contour of vA(x,0,z) = | B0(x,0,z) | in the y = 0, xz-plane. Contour is colour coded: 0 ≤ vA ≤ 0.3 (white); 0.3 ≤ vA ≤ 0.5724 (green); 0.5724 ≤ vA ≤ 2 (yellow); 2 ≤ vA ≤ 30 (orange); vA ≥ 30 (black). Red lines indicate the separatrices in this plane. c) Colour contour of vA(0,y,z) = | B0(0,y,z) | in the x = 0, yz-plane. Blue line indicates the X-line in this plane. Contour is colour coded in the same way as b). d) Plot of | Bx(0,r) | = vA(0,y,z) where r2 + y2 + z2 and axis displays 0.5 ≤ r ≤ 2. Colour coding corresponds to that of b) and c), except now black represents | Bx(0,r) | ≤ 0.3.
Current usage metrics show cumulative count of Article Views (full-text article views including HTML views, PDF and ePub downloads, according to the available data) and Abstracts Views on Vision4Press platform.
Data correspond to usage on the plateform after 2015. The current usage metrics is available 48-96 hours after online publication and is updated daily on week days.
Initial download of the metrics may take a while.