Fig. 5
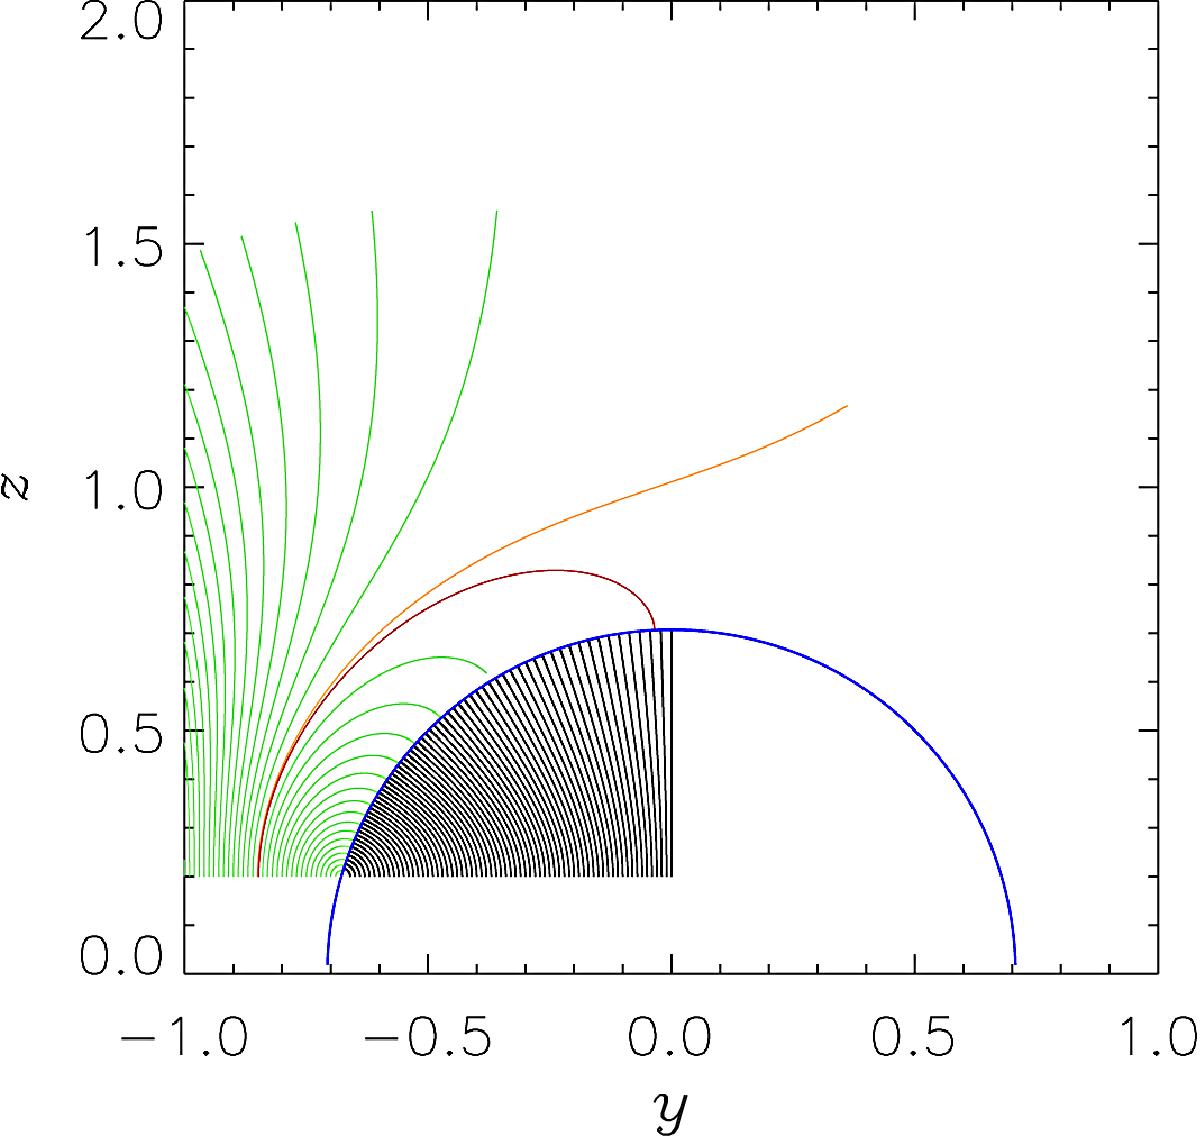
Particle paths for starting points of x0 = 0, −1 ≤ y0 ≤ 0 and z0 = 0.2. The X-line is indicated in blue. The lines for −1 ≤ y0< −0.6782 have been coloured green to distinguish them from the lines −0.6782 <y0 ≤ 0 which are black. The orange and red lines represents the particle paths for a starting point of y0 = −0.85 and x0 = −0.848, respectively.
Current usage metrics show cumulative count of Article Views (full-text article views including HTML views, PDF and ePub downloads, according to the available data) and Abstracts Views on Vision4Press platform.
Data correspond to usage on the plateform after 2015. The current usage metrics is available 48-96 hours after online publication and is updated daily on week days.
Initial download of the metrics may take a while.