Free Access
Fig. 1
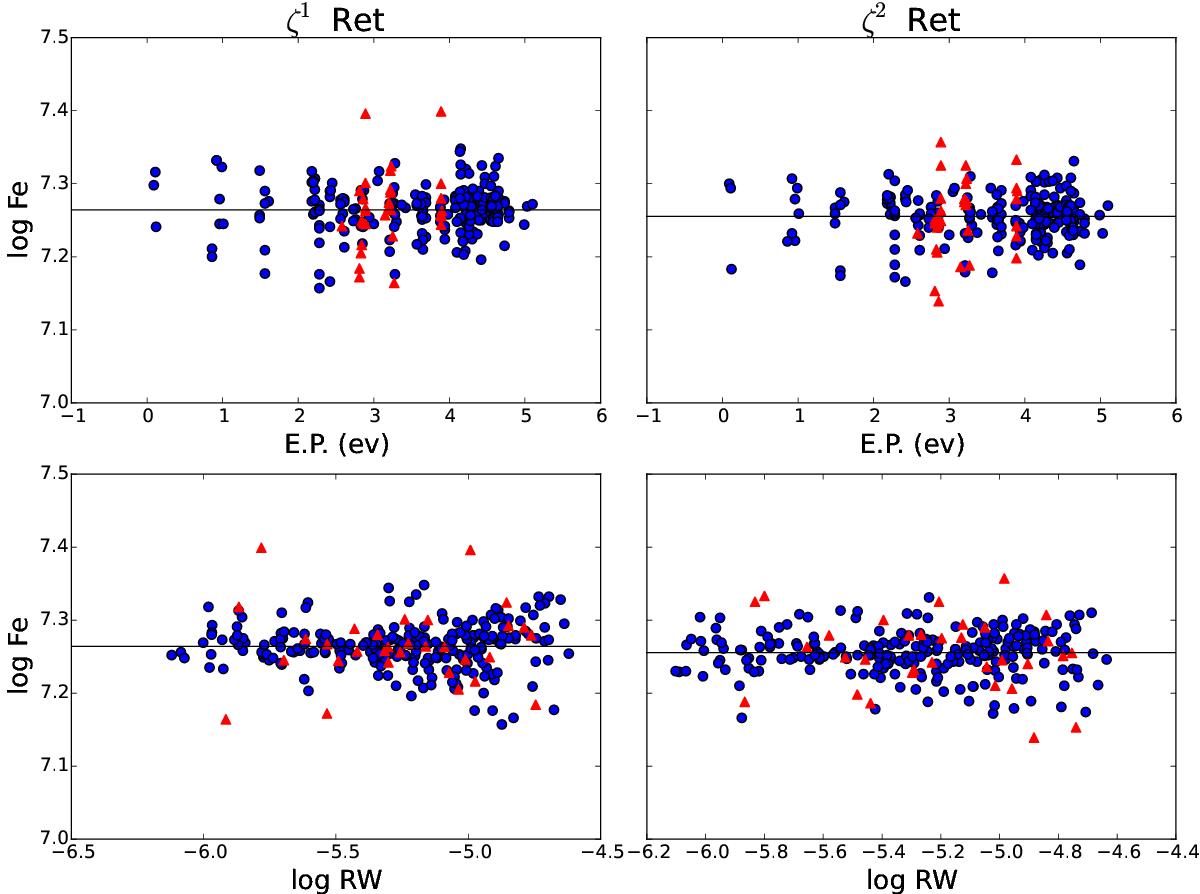
Iron abundance vs. excitation potential (upper panels) and iron abundance vs. reduced EW (lower panels) for ζ1 Ret_comb and ζ2 Ret_comb. The blue and red symbols correspond to the neutral and ionized iron lines. The black solid line indicates the linear fit of the data.
Current usage metrics show cumulative count of Article Views (full-text article views including HTML views, PDF and ePub downloads, according to the available data) and Abstracts Views on Vision4Press platform.
Data correspond to usage on the plateform after 2015. The current usage metrics is available 48-96 hours after online publication and is updated daily on week days.
Initial download of the metrics may take a while.