Fig. 1
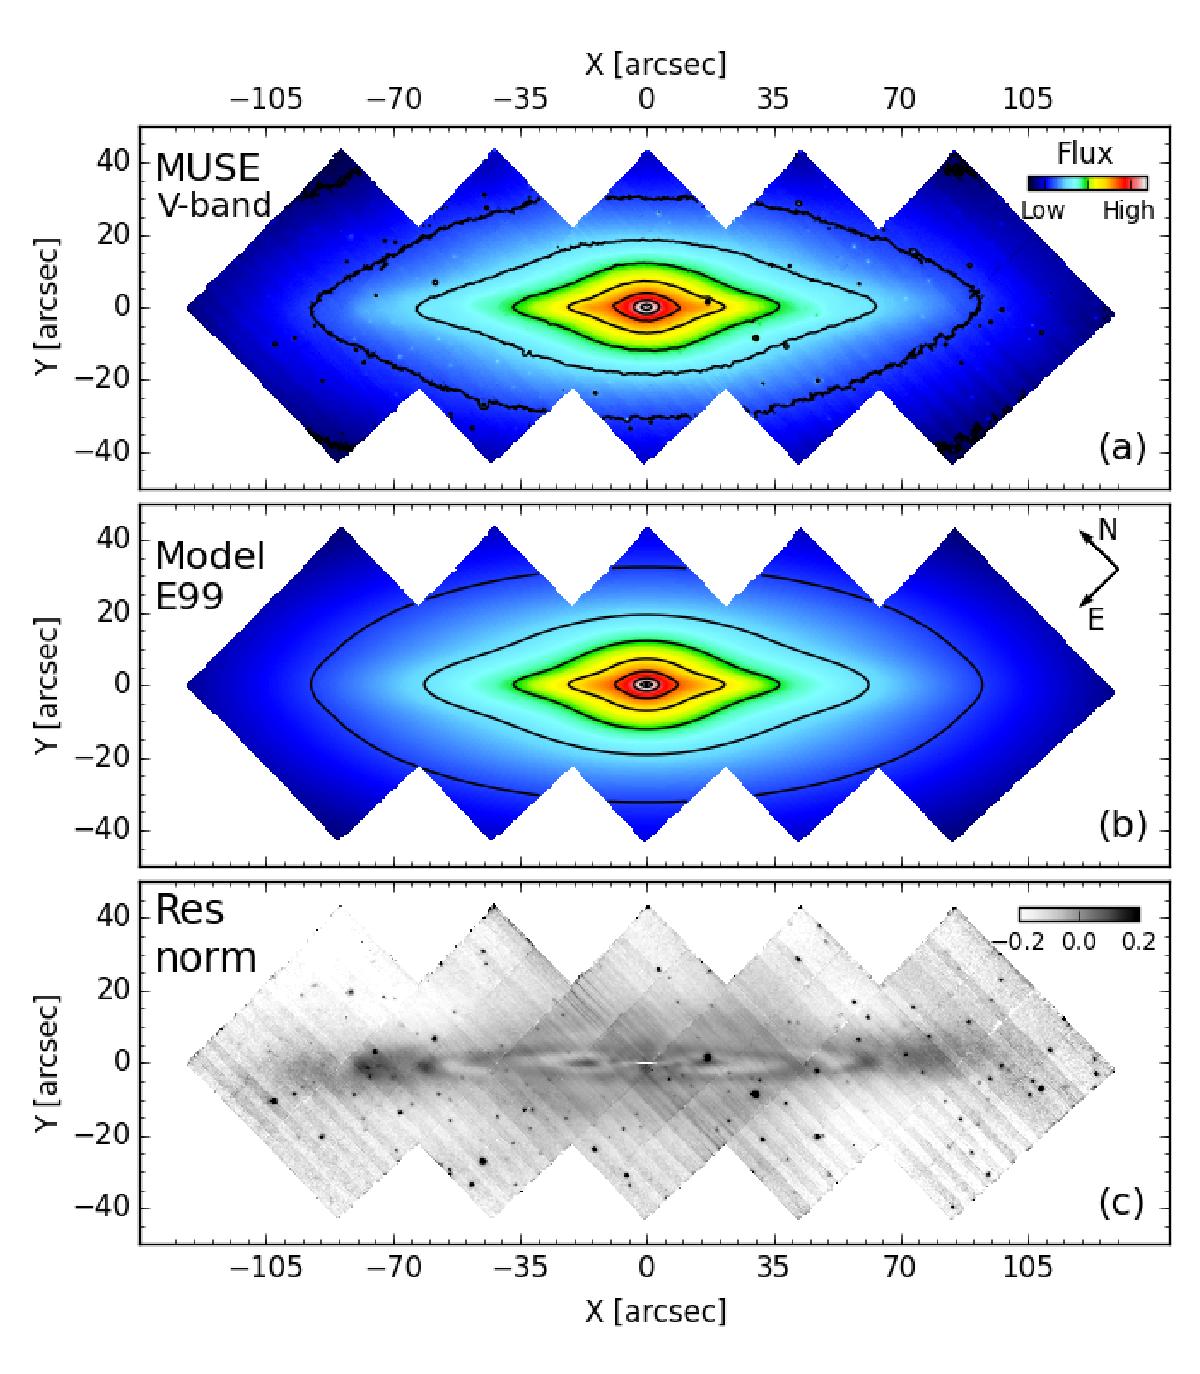
Panel a) MUSE reconstructed V-band image of NGC 3115 obtained through the MUSE pipeline. Panel b) photometric V-band model of NGC 3115 from Emsellem et al. (1999). The model flux is scaled to the MUSE V-band image, which is in arbitrary units. Panel c) normalised residuals of the MUSE reconstructed V-band image obtained by subtracting the Emsellem et al. (1999) model. The overall flatness of the residuals shows the good quality of our data reduction process (see Sect. 2.2). The significant residual structures (inner-disc, spirals, etc.) are discussed in Sect. 5.1.
Current usage metrics show cumulative count of Article Views (full-text article views including HTML views, PDF and ePub downloads, according to the available data) and Abstracts Views on Vision4Press platform.
Data correspond to usage on the plateform after 2015. The current usage metrics is available 48-96 hours after online publication and is updated daily on week days.
Initial download of the metrics may take a while.