Fig. D.2
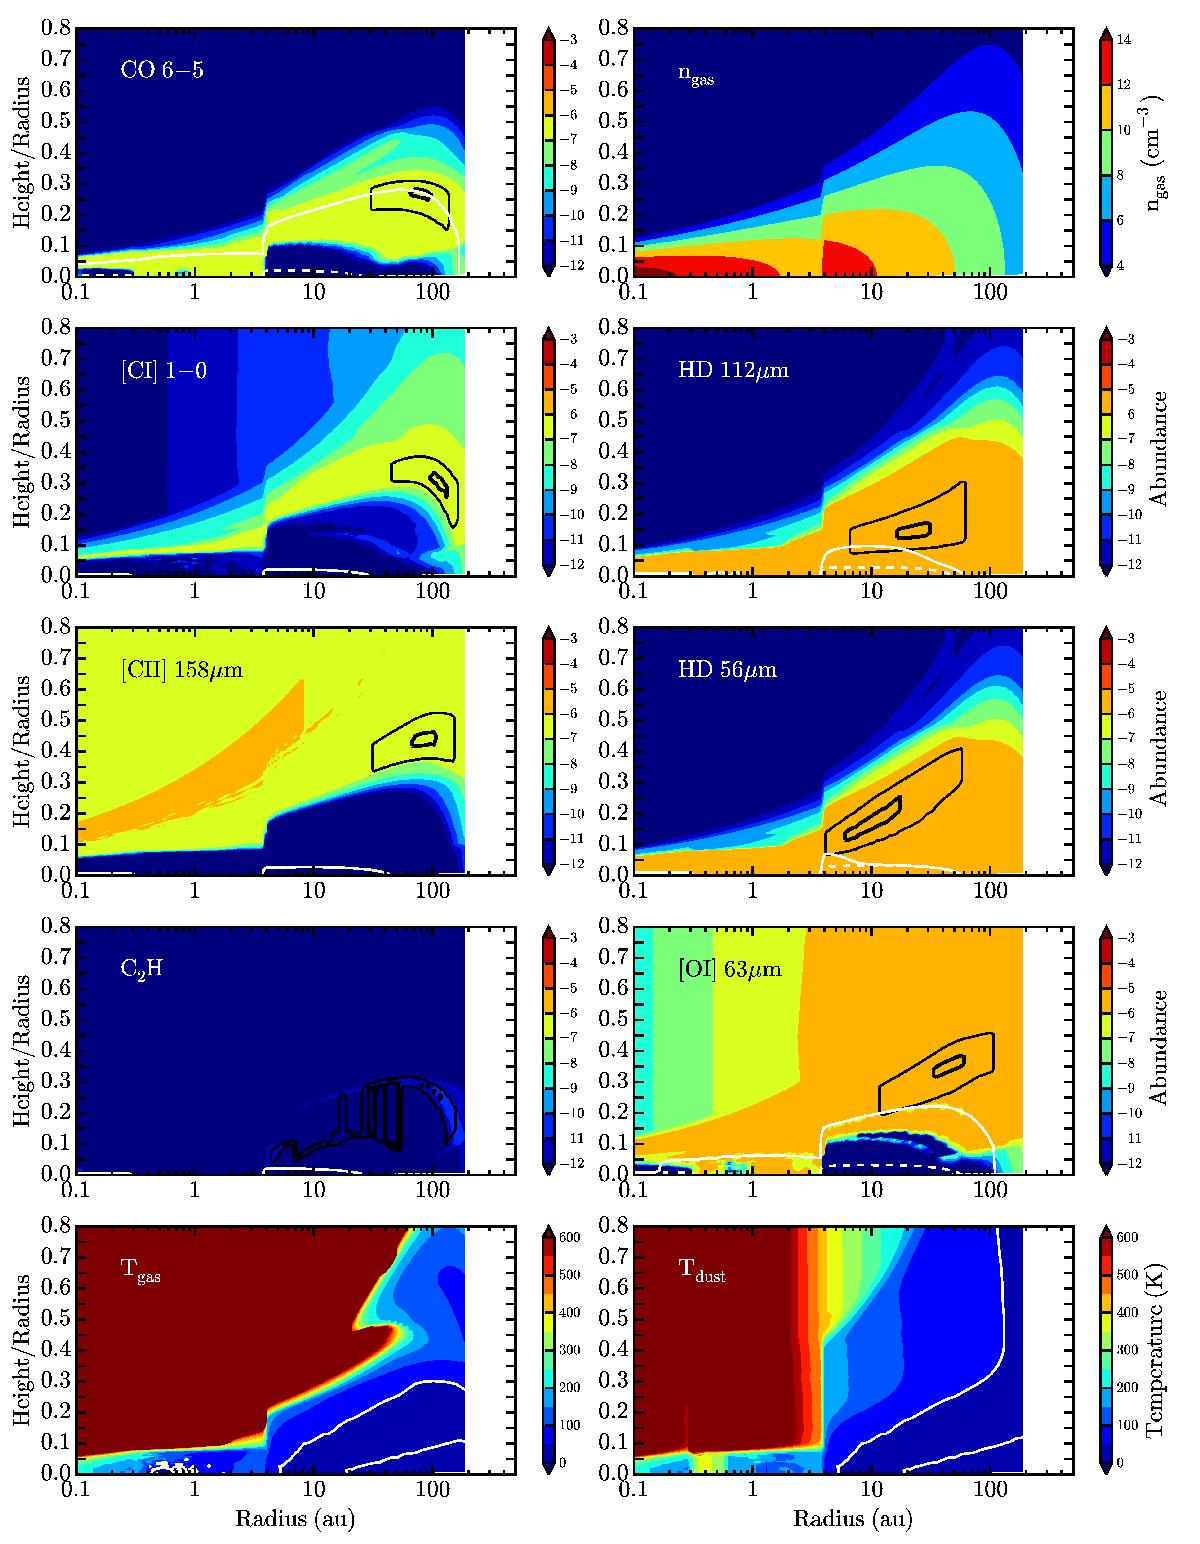
Disk structure and line contribution functions (CBFs) for the TW Hya model with Δgas / dust = 200 and [C]/[H]gas = 10-6 (depleted). The CBF panels show the abundance (colour fill) and line emission (black lines) of CO, [C i], C2H, [C ii], and HD. The black contours encompass 25 and 75% cumulative contributions to the line emission. The solid and dashed white lines show the τ = 1 surface for the line and continuum emission. The solid white lines for Tgas and Tdust are the 20 and 50 K isotherms.
Current usage metrics show cumulative count of Article Views (full-text article views including HTML views, PDF and ePub downloads, according to the available data) and Abstracts Views on Vision4Press platform.
Data correspond to usage on the plateform after 2015. The current usage metrics is available 48-96 hours after online publication and is updated daily on week days.
Initial download of the metrics may take a while.