Free Access
Fig. 1
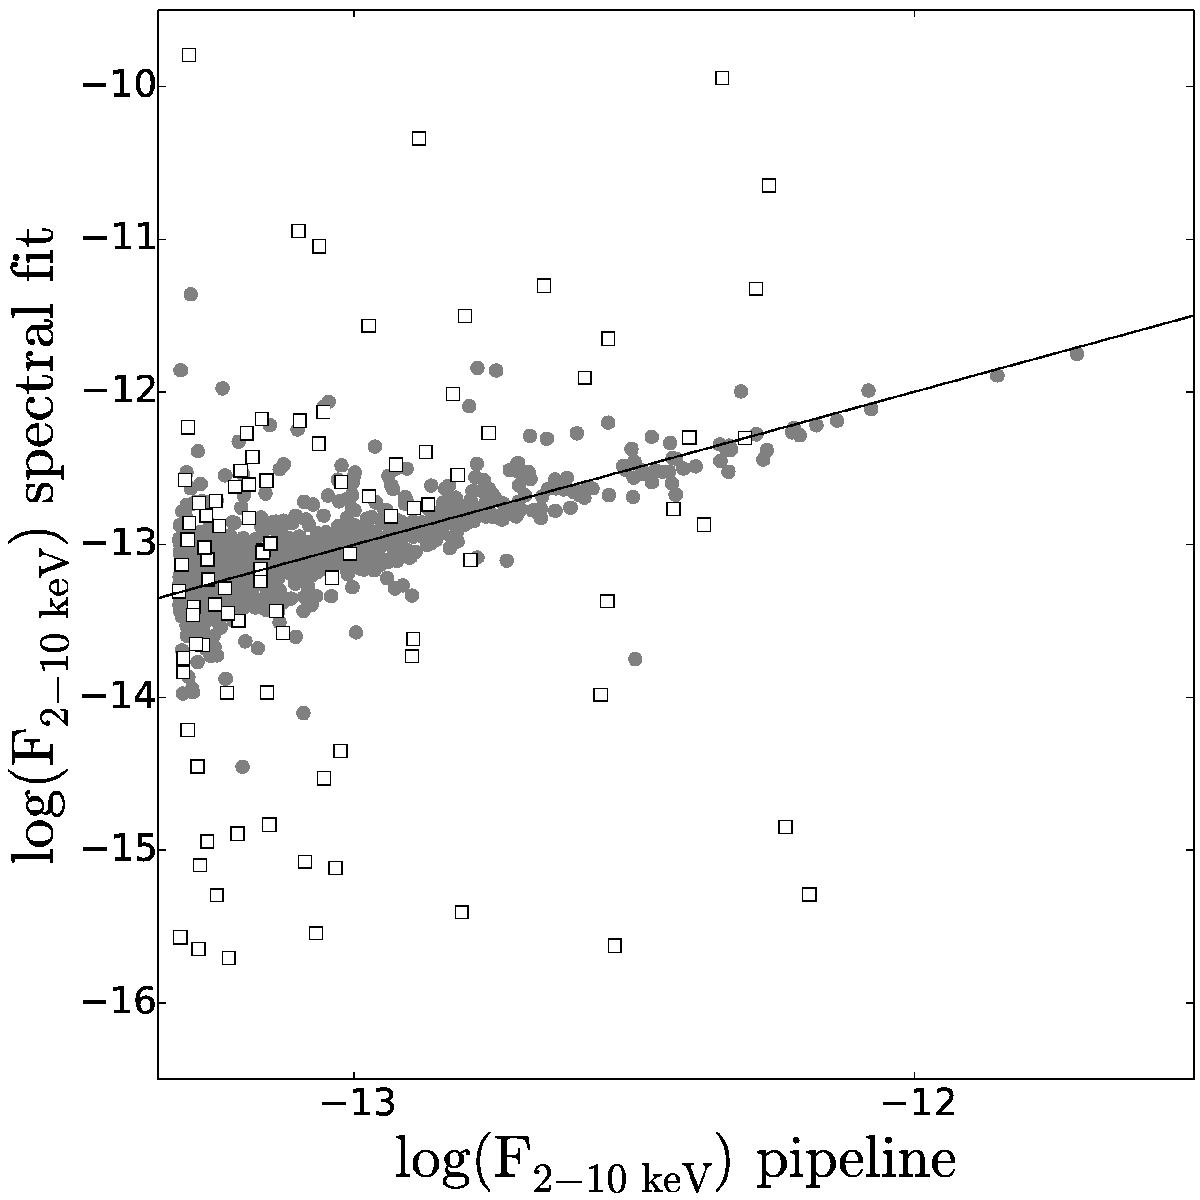
Comparison between the 2−10 keV flux estimated by Xamin 3.3 assuming a power-law spectrum with Γ = 1.7, NH = 2.6 × 1020 cm-2, and the spectral fit value (grey points). The black line shows the one-to-one relation. The open squares denote the sources that have low-quality X-ray spectra, (flag = 4, see Table 2).
Current usage metrics show cumulative count of Article Views (full-text article views including HTML views, PDF and ePub downloads, according to the available data) and Abstracts Views on Vision4Press platform.
Data correspond to usage on the plateform after 2015. The current usage metrics is available 48-96 hours after online publication and is updated daily on week days.
Initial download of the metrics may take a while.