Fig. 10
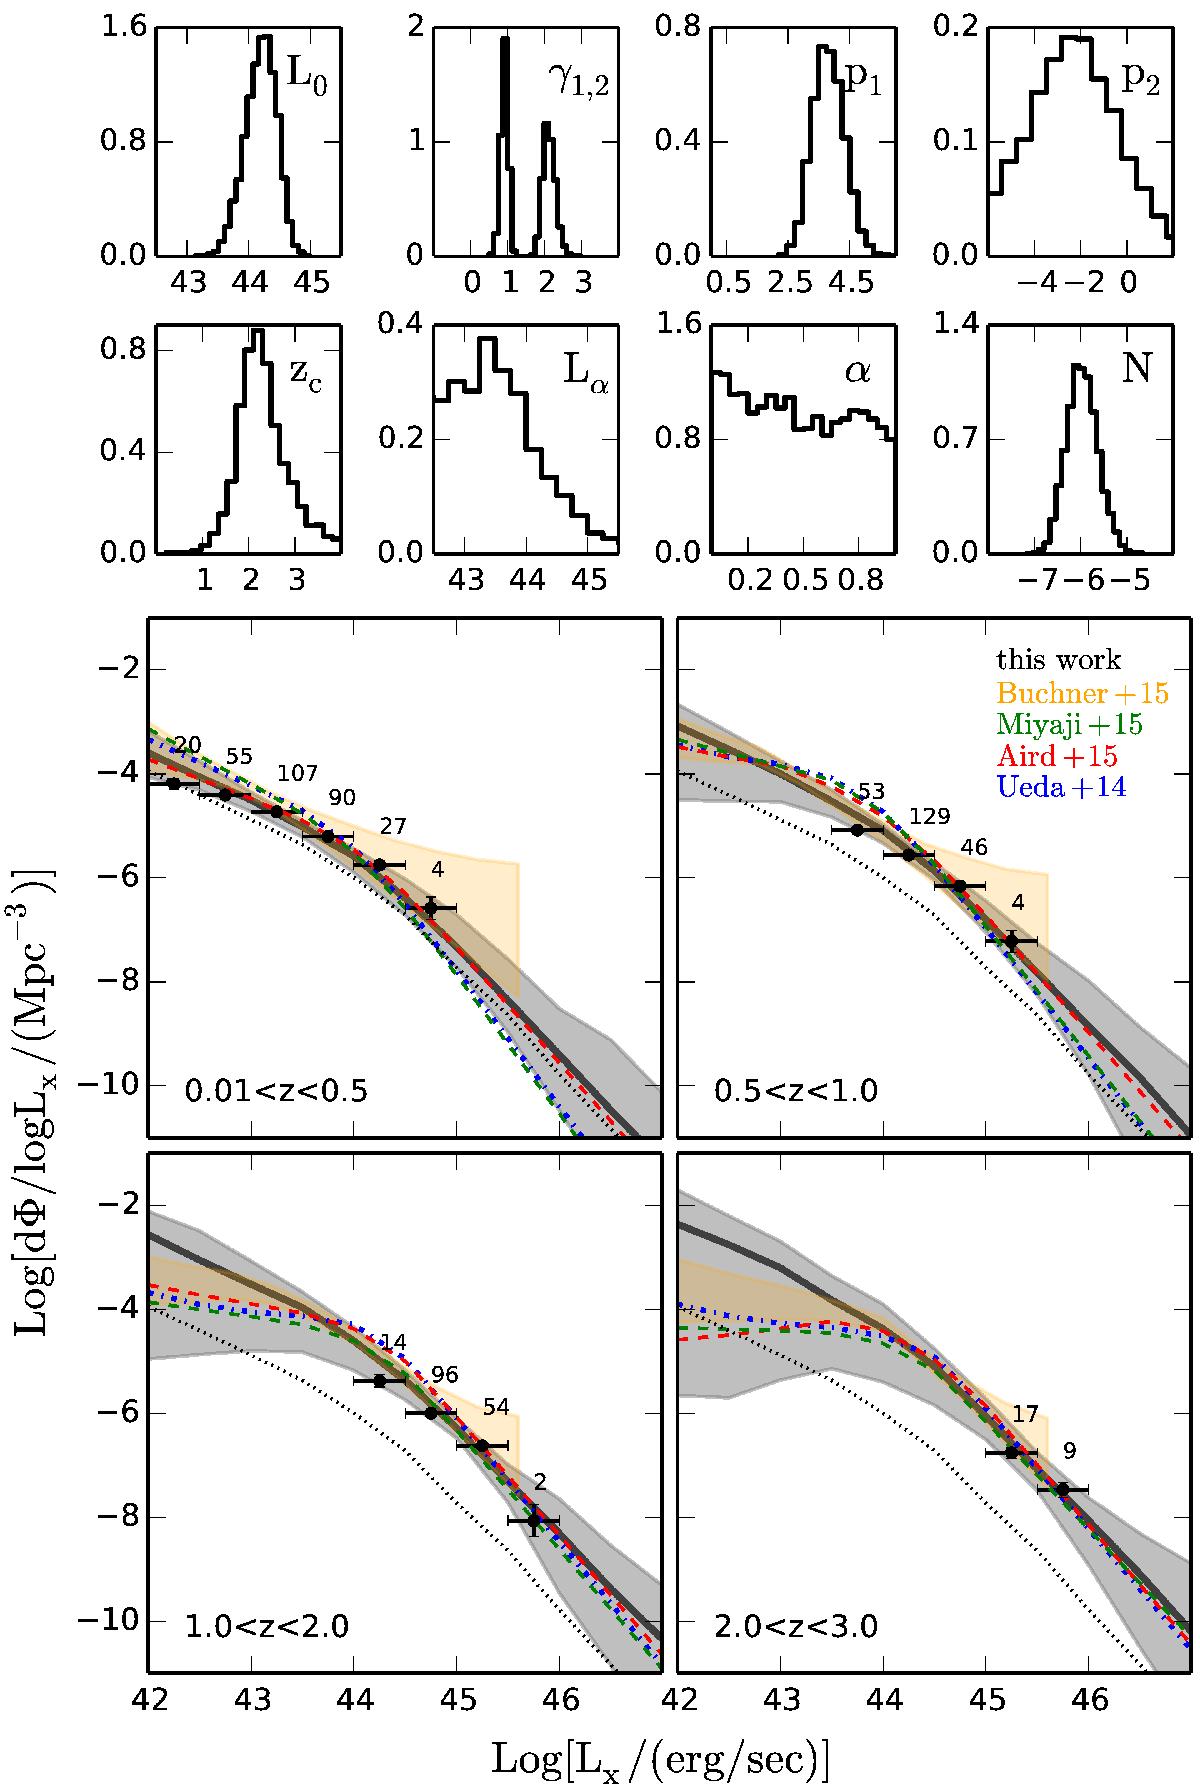
X-ray luminosity function from the XXL-1000-AGN sample. The upper panels show the marginalised posterior distribution of the parameters in luminosity dependent density evolution (LDDE) model. The bottom panels show the estimated XLF as a function of luminosity in four redshift bins. The black solid line shows the mode of the distribution and the grey shaded area encloses the 90% credible interval. The dotted black line is our estimated z = 0 XLF shown for reference in all plots. The black points are estimated using the 1 /Vmax method in good agreement with our modelling. The numbers above the points show the number of objects per bin. They also show the parameter space occupied by the XXL-1000-AGN sample. The orange area and dashed lines show 2−10 keV XLF estimates from the literature (orange: Buchner et al. 2015; green: Miyaji et al. 2015; red: Aird et al. 2015; blue: Ueda et al. 2014).
Current usage metrics show cumulative count of Article Views (full-text article views including HTML views, PDF and ePub downloads, according to the available data) and Abstracts Views on Vision4Press platform.
Data correspond to usage on the plateform after 2015. The current usage metrics is available 48-96 hours after online publication and is updated daily on week days.
Initial download of the metrics may take a while.