Fig. 2
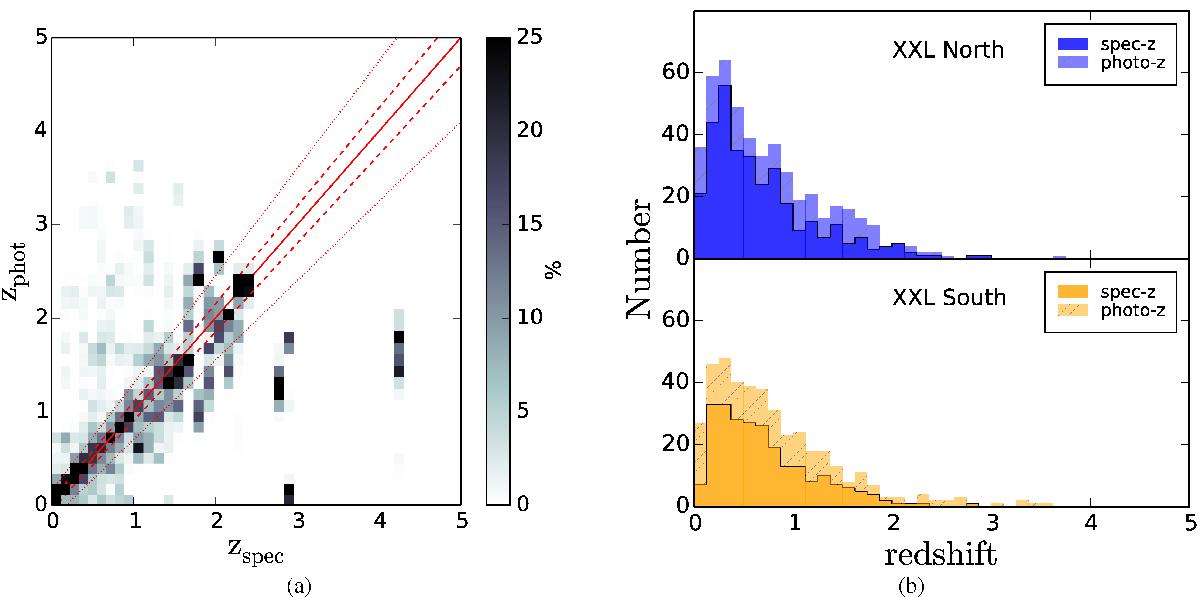
a) Spectroscopic versus photometric redshift for the 339 XXL-1000-AGN sources not included in the Random Forest training. The plot is a 2D histogram of the stacked photo-z probability distribution functions and the colourbar shows the probability enclosed in each cell for a given spectroscopic redshift slice (Δz = 0.1). The solid red line is the diagonal, the dashed and dotted lines are 0.10 × (1 + zspec) and 0.15 × (1 + zspec) respectively. Sources outside the dotted line are considered outliers. b) Redshift distribution of XXL-N (blue) and XXL-S (orange) fields. The solid histograms show the distribution of spectroscopic redshift, the stacked hatched bars show the distribution of additional photometric redshift when spectroscopic redshifts are not available. The combined height shows the total redshift distribution in each field.
Current usage metrics show cumulative count of Article Views (full-text article views including HTML views, PDF and ePub downloads, according to the available data) and Abstracts Views on Vision4Press platform.
Data correspond to usage on the plateform after 2015. The current usage metrics is available 48-96 hours after online publication and is updated daily on week days.
Initial download of the metrics may take a while.