Fig. 4
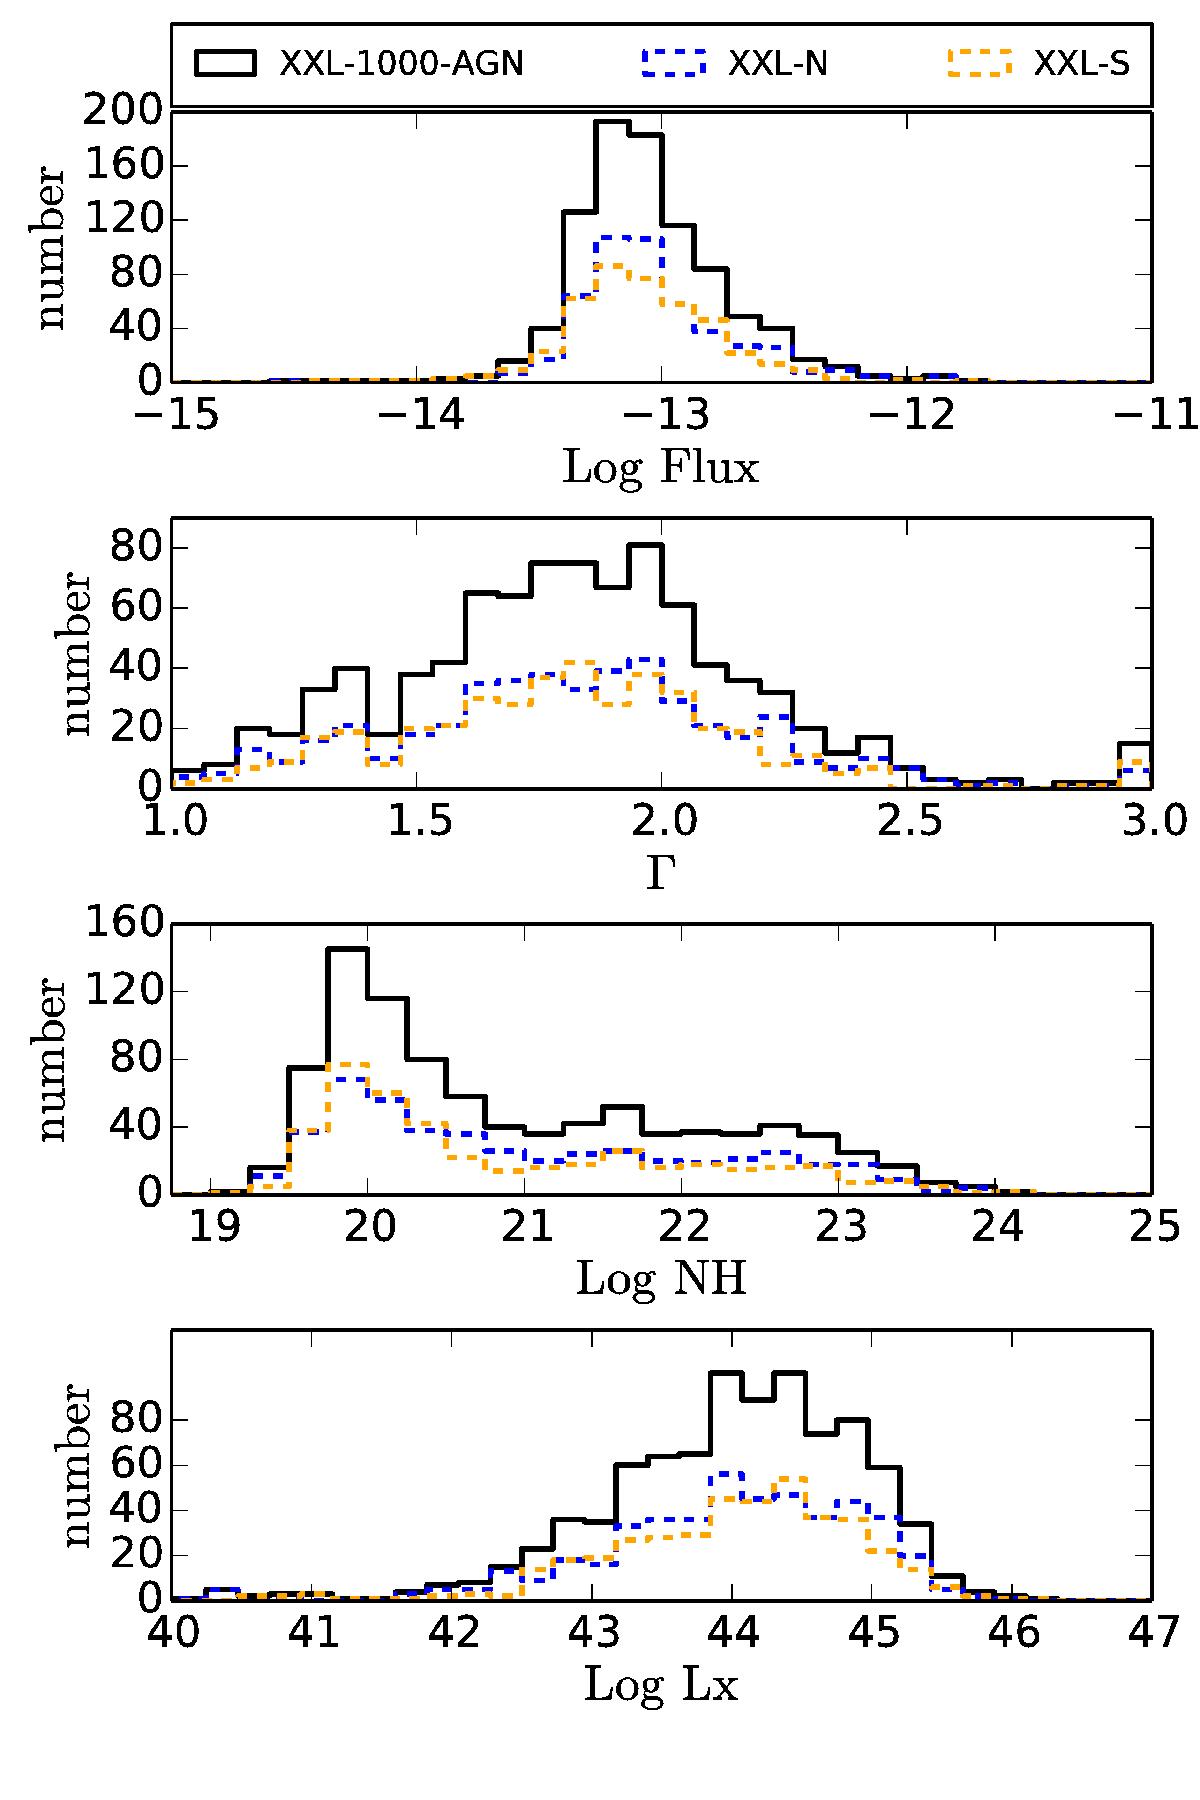
Panels from top to bottom: distribution of logarithms of the intrinsic flux determined by the absorbed power law, the photon index Γ, the logarithm of the hydrogen column density, the logarithm of the intrinsic luminosity in the 2−10 keV energy band. In all panels we show the distribution for XXL-N (blue lines) and XXL-S (orange lines) separately. The black line shows the XXL-1000-AGN sample.
Current usage metrics show cumulative count of Article Views (full-text article views including HTML views, PDF and ePub downloads, according to the available data) and Abstracts Views on Vision4Press platform.
Data correspond to usage on the plateform after 2015. The current usage metrics is available 48-96 hours after online publication and is updated daily on week days.
Initial download of the metrics may take a while.