Fig. 6
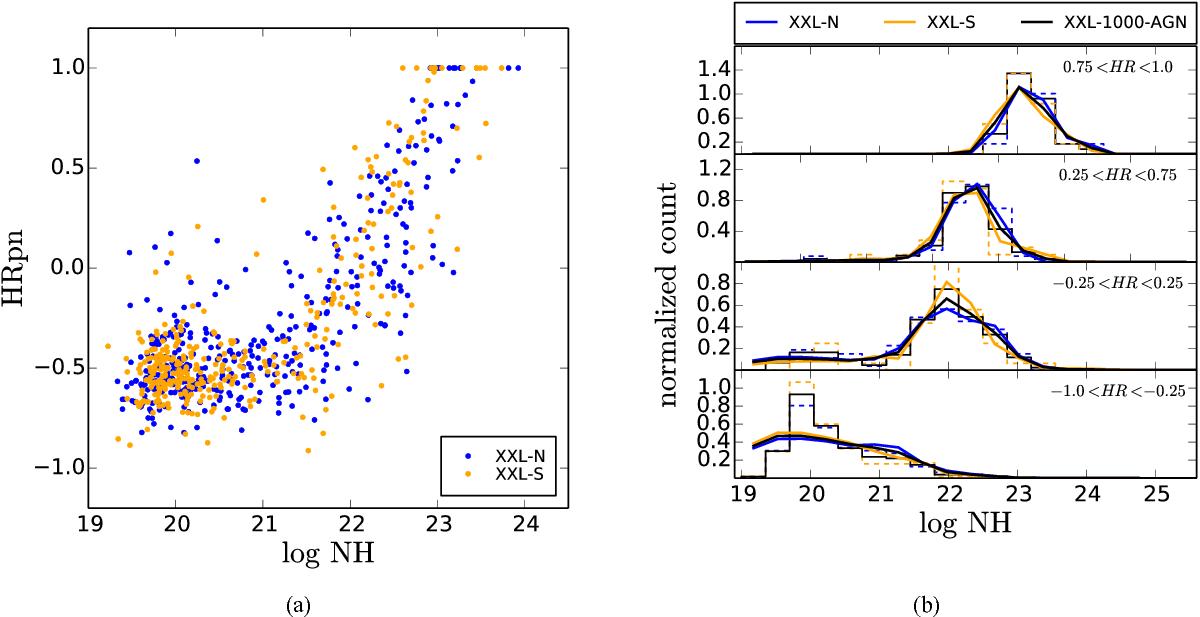
a) Hardness ratio versus log NH for the XXL-N (blue points) and XXL-S (orange points); the hardness ratio is in good agreement with the estimated log NH from the X-ray spectra. b) log NH for four hardness ratio bins. The normalised dashed histograms represent the observed values in the XXL-N (blue) and XXL-S (orange) and the combined XXL-1000-AGN sample (solid black histogram). The solid lines show the combined log NH PDF of the sources in each bin (see Appendix B for the tabulated values of these curves).
Current usage metrics show cumulative count of Article Views (full-text article views including HTML views, PDF and ePub downloads, according to the available data) and Abstracts Views on Vision4Press platform.
Data correspond to usage on the plateform after 2015. The current usage metrics is available 48-96 hours after online publication and is updated daily on week days.
Initial download of the metrics may take a while.