Fig. 9
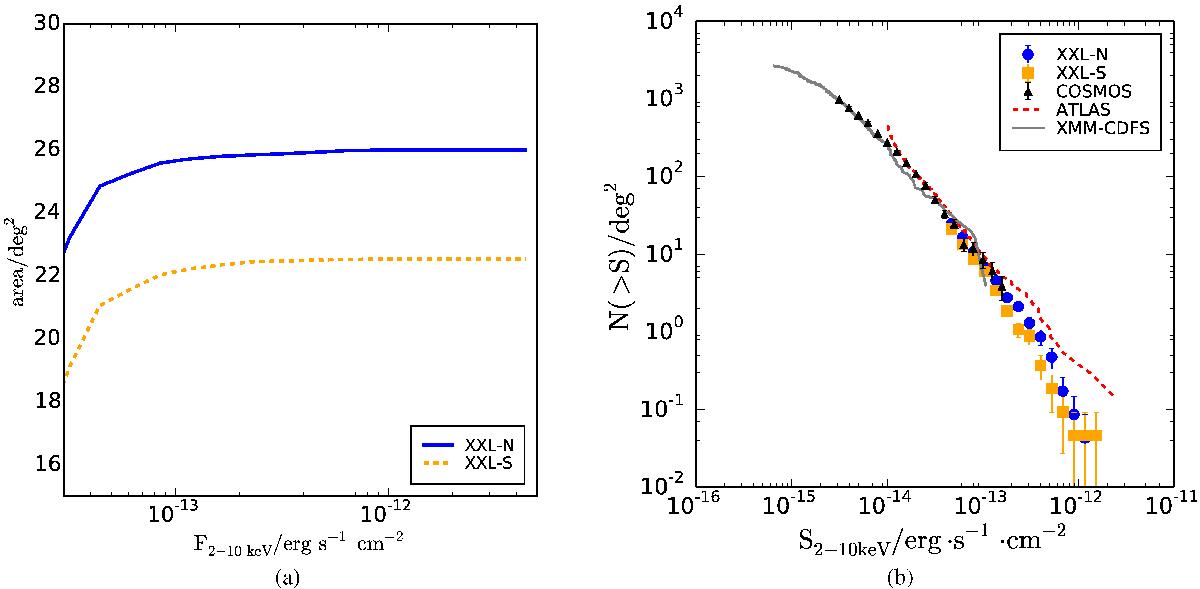
a) Area detection efficiency as a function of 2−10 keV X-ray flux for the XXL-1000-AGN sample. These curves were used for the calculation of the number counts and the AGN luminosity function. b) log N−log S for the XXL-1000-AGN in the XXL-N field (blue circles) and in the XXL-S field (orange squares). The black points are the number counts of XMM-COSMOS, the red line shows the cumber counts from the H-ATLAS, and the grey line the number counts of XMM-CDFS.
Current usage metrics show cumulative count of Article Views (full-text article views including HTML views, PDF and ePub downloads, according to the available data) and Abstracts Views on Vision4Press platform.
Data correspond to usage on the plateform after 2015. The current usage metrics is available 48-96 hours after online publication and is updated daily on week days.
Initial download of the metrics may take a while.