Fig. 4
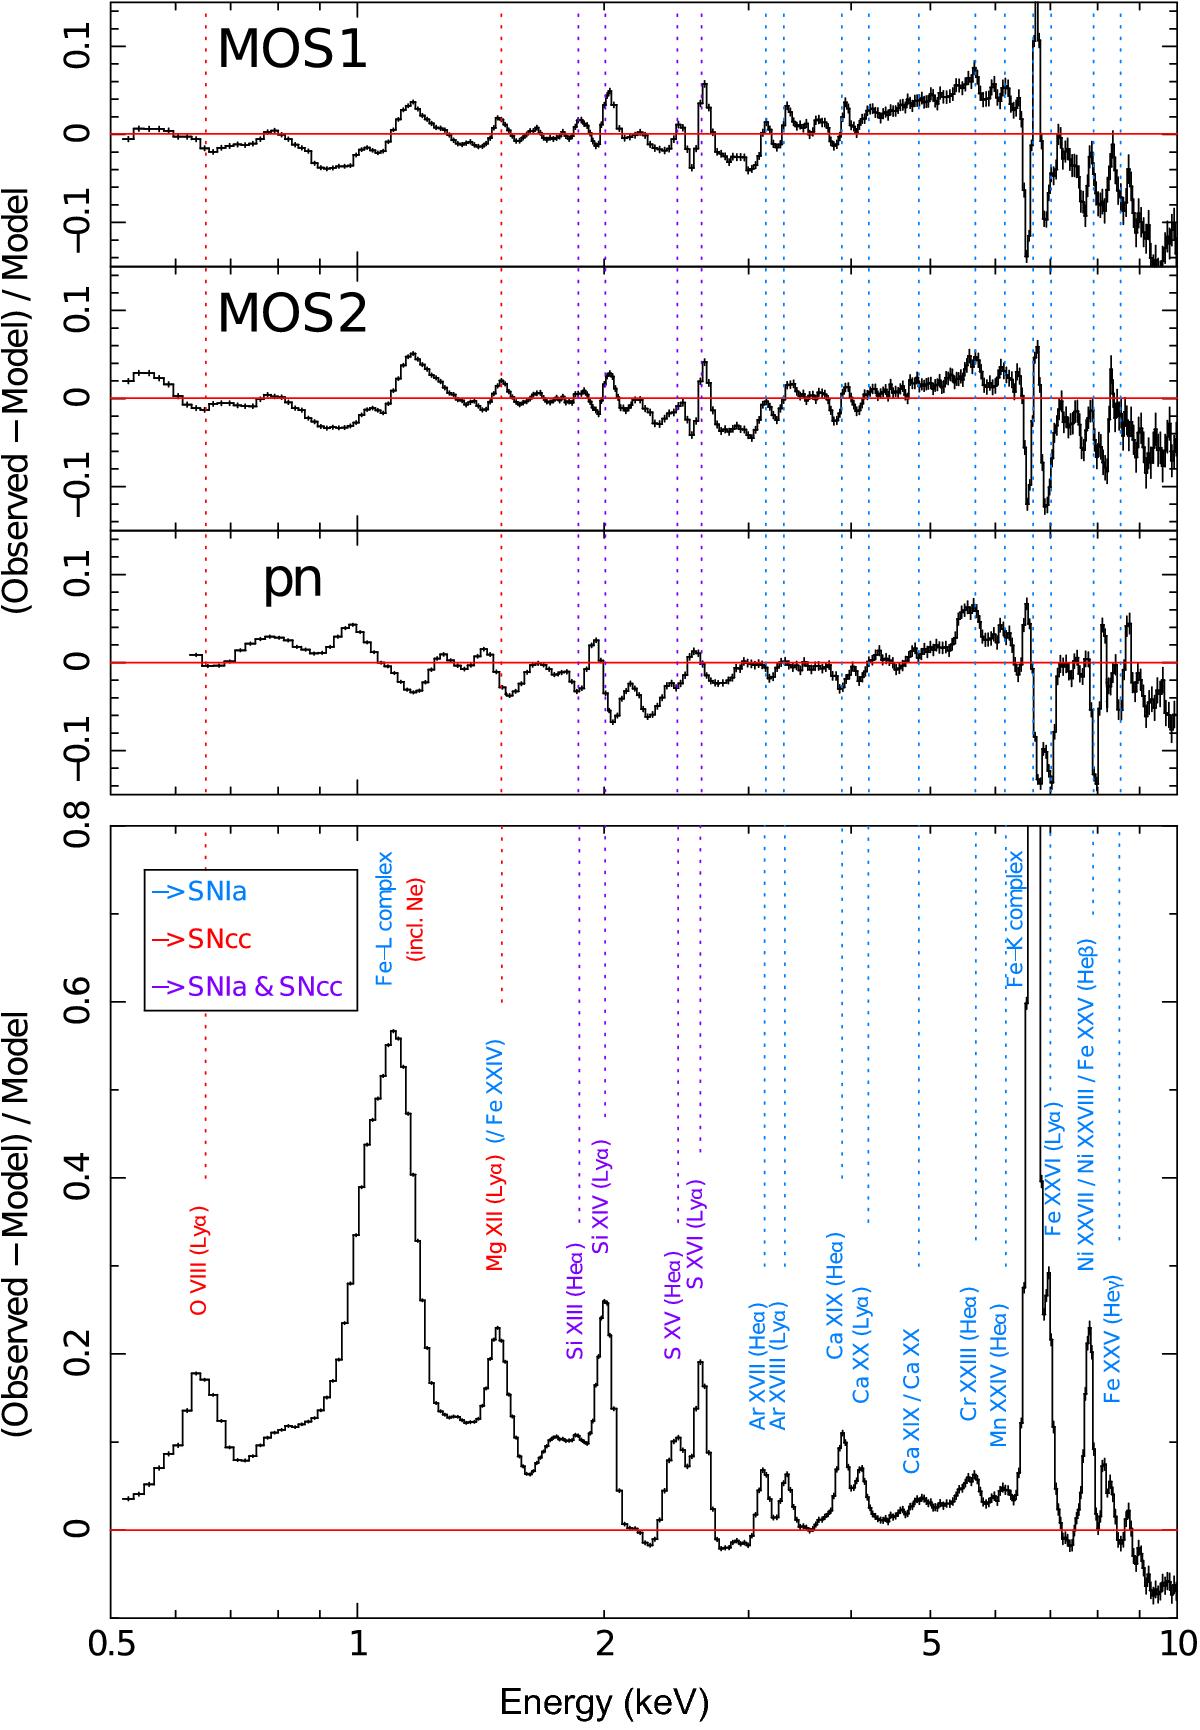
Top: EPIC MOS 1, MOS 2, and pn stacked and redshift-corrected residuals of the (0.05 + 0.2)r500 sample (using a gdem model). Before stacking, the MOS and pn spectra of every pointing were fitted simultaneously with coupled parameters. The vertical dotted lines indicate the position of the detected line emissions in the EPIC spectra (see lower panel). Bottom: EPIC stacked and redshift-corrected residuals of the (0.05 + 0.2)r500 sample (using a gdem model, all instruments combined). Before stacking, the MOS and pn spectra of every pointing were fitted independently and the line emission was set to zero in the model. The height of the peak of the Fe-K complex is ~1.95.
Current usage metrics show cumulative count of Article Views (full-text article views including HTML views, PDF and ePub downloads, according to the available data) and Abstracts Views on Vision4Press platform.
Data correspond to usage on the plateform after 2015. The current usage metrics is available 48-96 hours after online publication and is updated daily on week days.
Initial download of the metrics may take a while.