Fig. 17
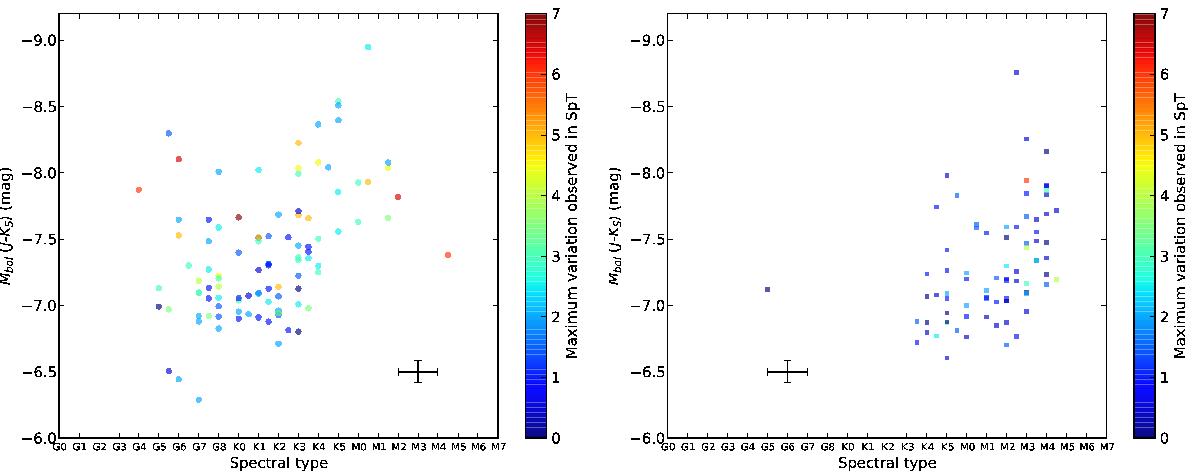
Spectral type against Mbol (derived from (J−KS)). Colour indicates the maximum SpT variation observed for each star among the epochs it was observed (see Sect. 3.2 for more details). The samples used here are the same as in Fig. 16, but we have represented only those stars observed on more than one epoch. The black cross represents the median uncertainties. The x-axis scale is the same as in Fig. 16 to ease the comparison. Left a): CSGs from the SMC. Right b): CSGs from the LMC.
Current usage metrics show cumulative count of Article Views (full-text article views including HTML views, PDF and ePub downloads, according to the available data) and Abstracts Views on Vision4Press platform.
Data correspond to usage on the plateform after 2015. The current usage metrics is available 48-96 hours after online publication and is updated daily on week days.
Initial download of the metrics may take a while.