Fig. 19
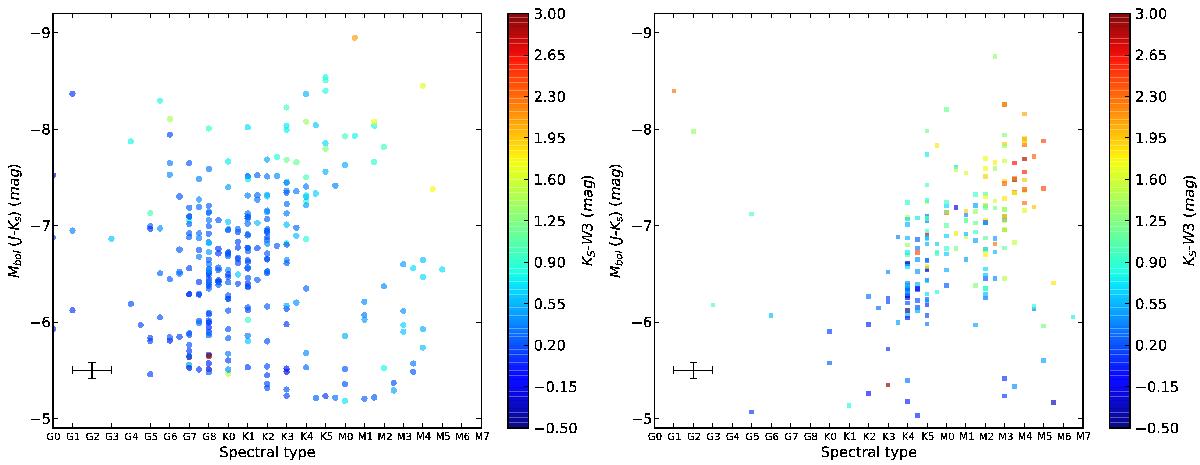
Spectral type to Mbol (derived from (J−KS). Colour indicates the value of KS− [W3], which is related to mass-loss (see text). The LMC data correspond to 2013 and the SMC data correspond to 2012, because all the stars observed in 2010 and 2011 were also observed in 2012 and 2013 and we wanted to avoid to alter the same CSG more than once. The black cross represents the median uncertainties. We note that both figures are in the same scale, to facilitate the comparison. Left a): CSGs from the SMC. Right b): CSGs from the LMC.
Current usage metrics show cumulative count of Article Views (full-text article views including HTML views, PDF and ePub downloads, according to the available data) and Abstracts Views on Vision4Press platform.
Data correspond to usage on the plateform after 2015. The current usage metrics is available 48-96 hours after online publication and is updated daily on week days.
Initial download of the metrics may take a while.