Fig. 22
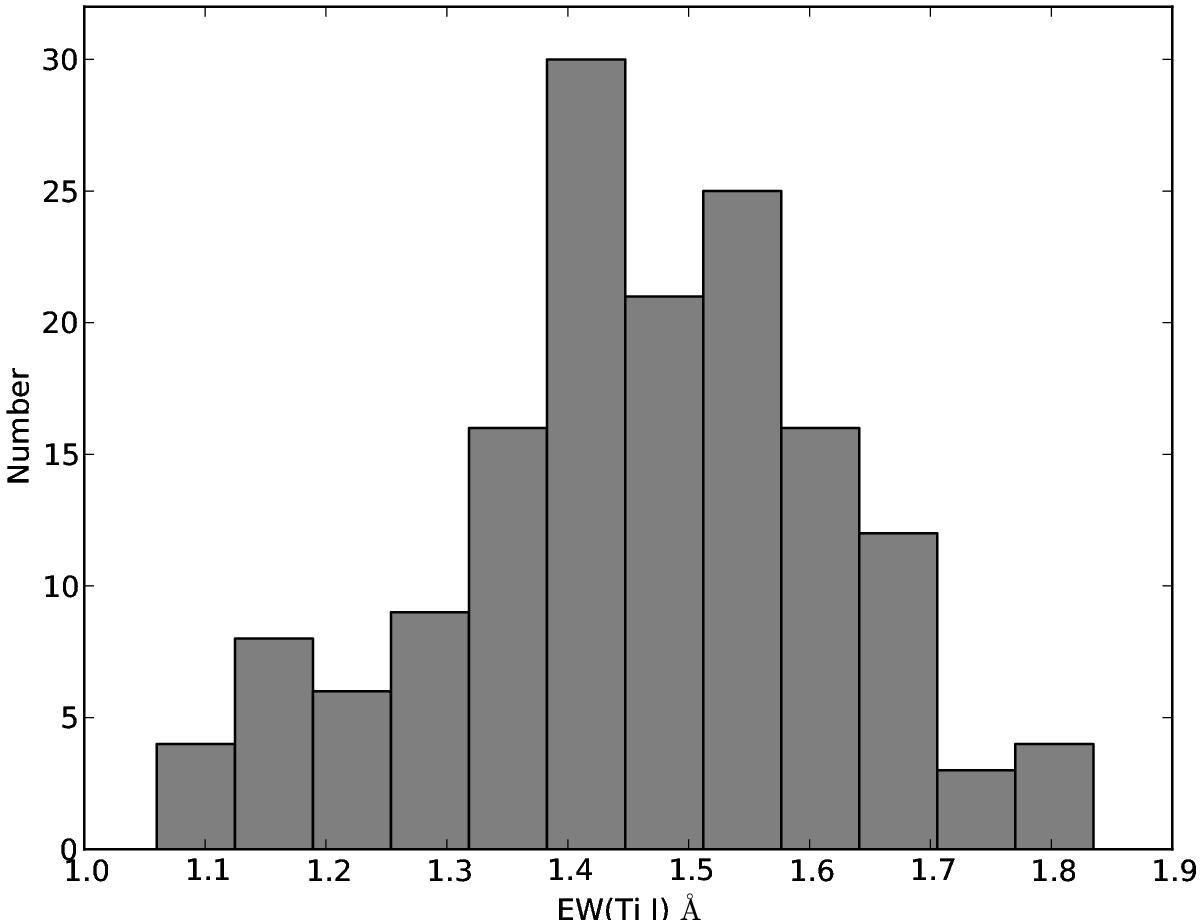
Histogram of the sums of the equivalent widths of Ti i, for the LMC 2013 sample. The CSGs later than M3 have been not included here, because their EW(Ti i) are affected by TiO bands (see Sect. 2.2). The few and scatter CSGs with values of EW(Ti i) lower than 1Å were considered outliers for this histogram and were not included. The width of the bins have been calculated by the Freedman-Diaconis rule, multiplied by a factor of 0.8.
Current usage metrics show cumulative count of Article Views (full-text article views including HTML views, PDF and ePub downloads, according to the available data) and Abstracts Views on Vision4Press platform.
Data correspond to usage on the plateform after 2015. The current usage metrics is available 48-96 hours after online publication and is updated daily on week days.
Initial download of the metrics may take a while.