Fig. 4
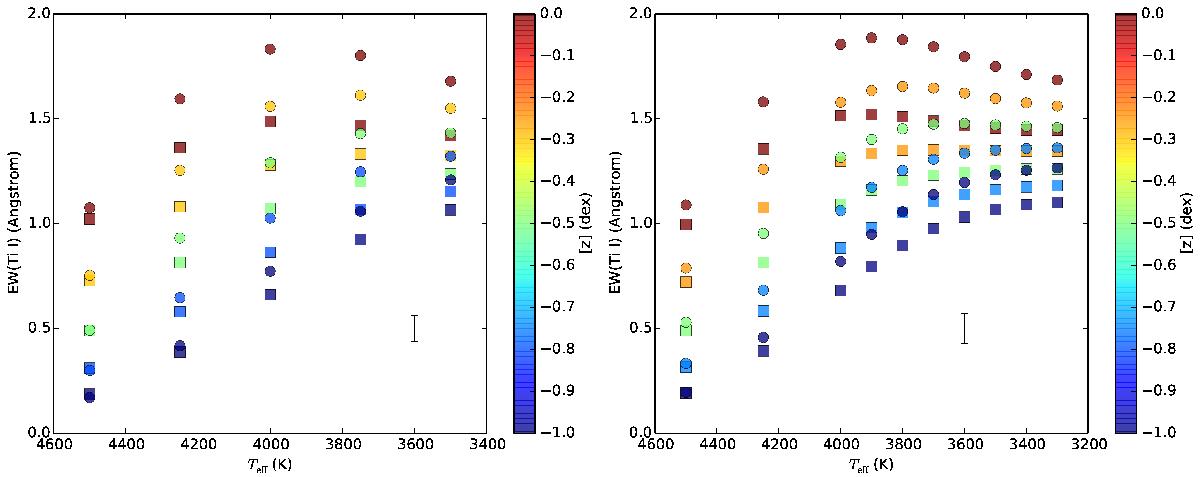
EW(Ti i) index measured in two grids of synthetic spectra based on KURUCZ (left) and MARCS (right) atmospheric models. The x-axis shows effective temperature (with inverted scale to ease the comparison with the SpT sequence), the colours indicate metallicity [Z] and the shapes indicate surface gravity (circles are log g = 0.0 and squares log g = 1.0 dex) of each synthetic spectrum from the grid. The vertical bar represents the median error in EW(Ti i) measurements.
Current usage metrics show cumulative count of Article Views (full-text article views including HTML views, PDF and ePub downloads, according to the available data) and Abstracts Views on Vision4Press platform.
Data correspond to usage on the plateform after 2015. The current usage metrics is available 48-96 hours after online publication and is updated daily on week days.
Initial download of the metrics may take a while.