Fig. 7
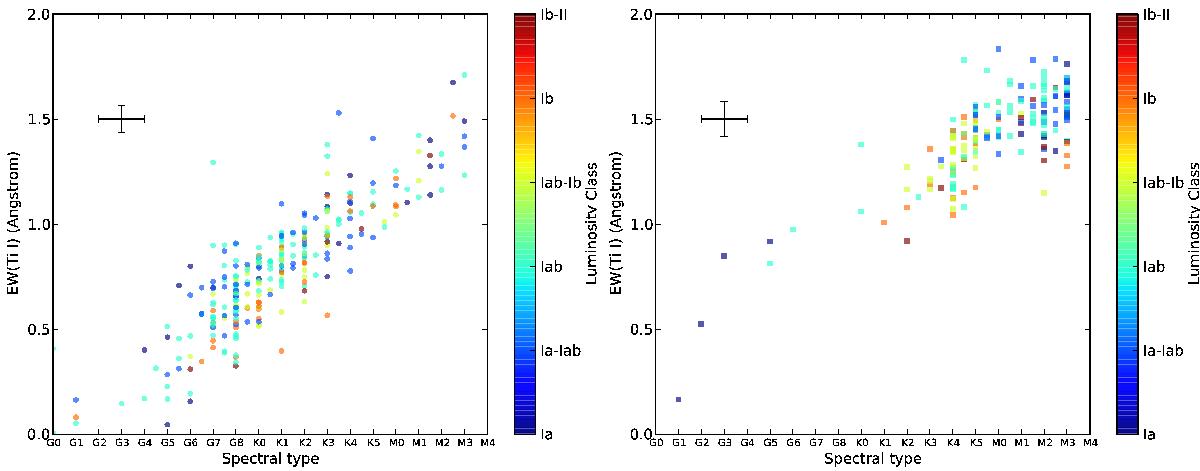
Sum of Ti i equivalent widths against spectral type. The colour indicates luminosity class. The black cross represents the median uncertainties. The LMC data correspond to 2013 and the SMC data correspond to 2012, because all the stars observed in 2010 and 2011 were also observed in 2012 and 2013, and so each star is represented only once. We note that these figures present the same variables than in Fig. 1, but here we have split the data from each galaxy for clarity, easing the comparison with Figs. 8 and 9, and they do not include those SGs later than M3, as their measurements are compromised by the TiO bands. Note also that both figures are on the same scale to make comparison easier. Left a): CSGs from the SMC. Right b): CSGs from the LMC.
Current usage metrics show cumulative count of Article Views (full-text article views including HTML views, PDF and ePub downloads, according to the available data) and Abstracts Views on Vision4Press platform.
Data correspond to usage on the plateform after 2015. The current usage metrics is available 48-96 hours after online publication and is updated daily on week days.
Initial download of the metrics may take a while.