Free Access
Fig. 2
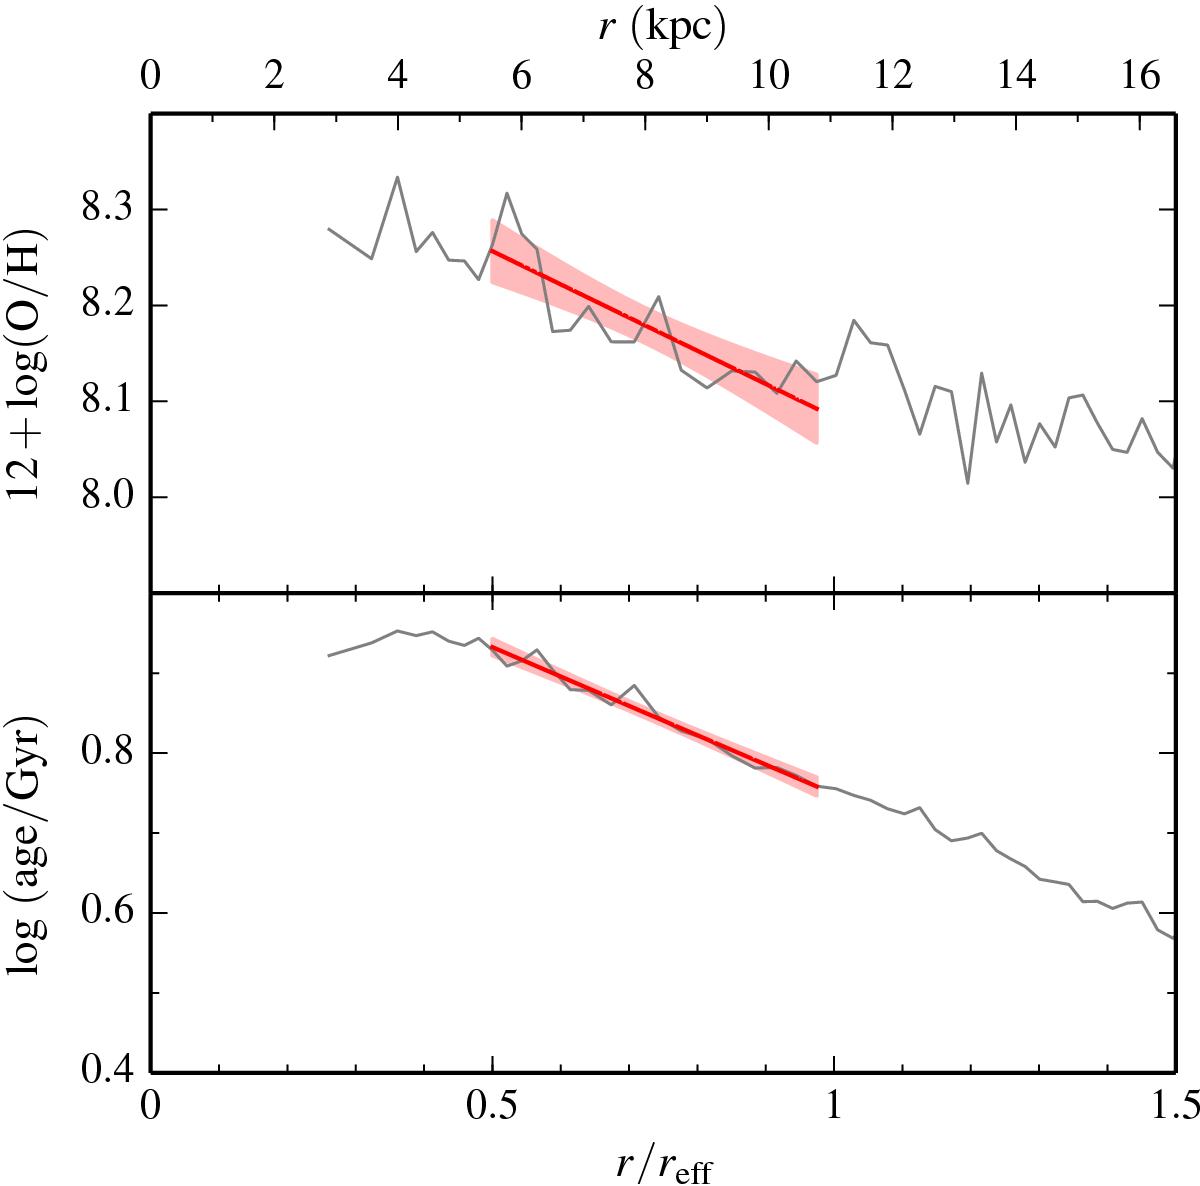
Metallicity and age profiles for the SPs in the stellar disc component of the galaxy shown in Fig. 1 (thin grey lines). The thick red lines are the linear fits within the region 0.5 <r/reff< 1. The shaded areas represent the 95 per cent confidence bands of the fits.
Current usage metrics show cumulative count of Article Views (full-text article views including HTML views, PDF and ePub downloads, according to the available data) and Abstracts Views on Vision4Press platform.
Data correspond to usage on the plateform after 2015. The current usage metrics is available 48-96 hours after online publication and is updated daily on week days.
Initial download of the metrics may take a while.