Fig. 3
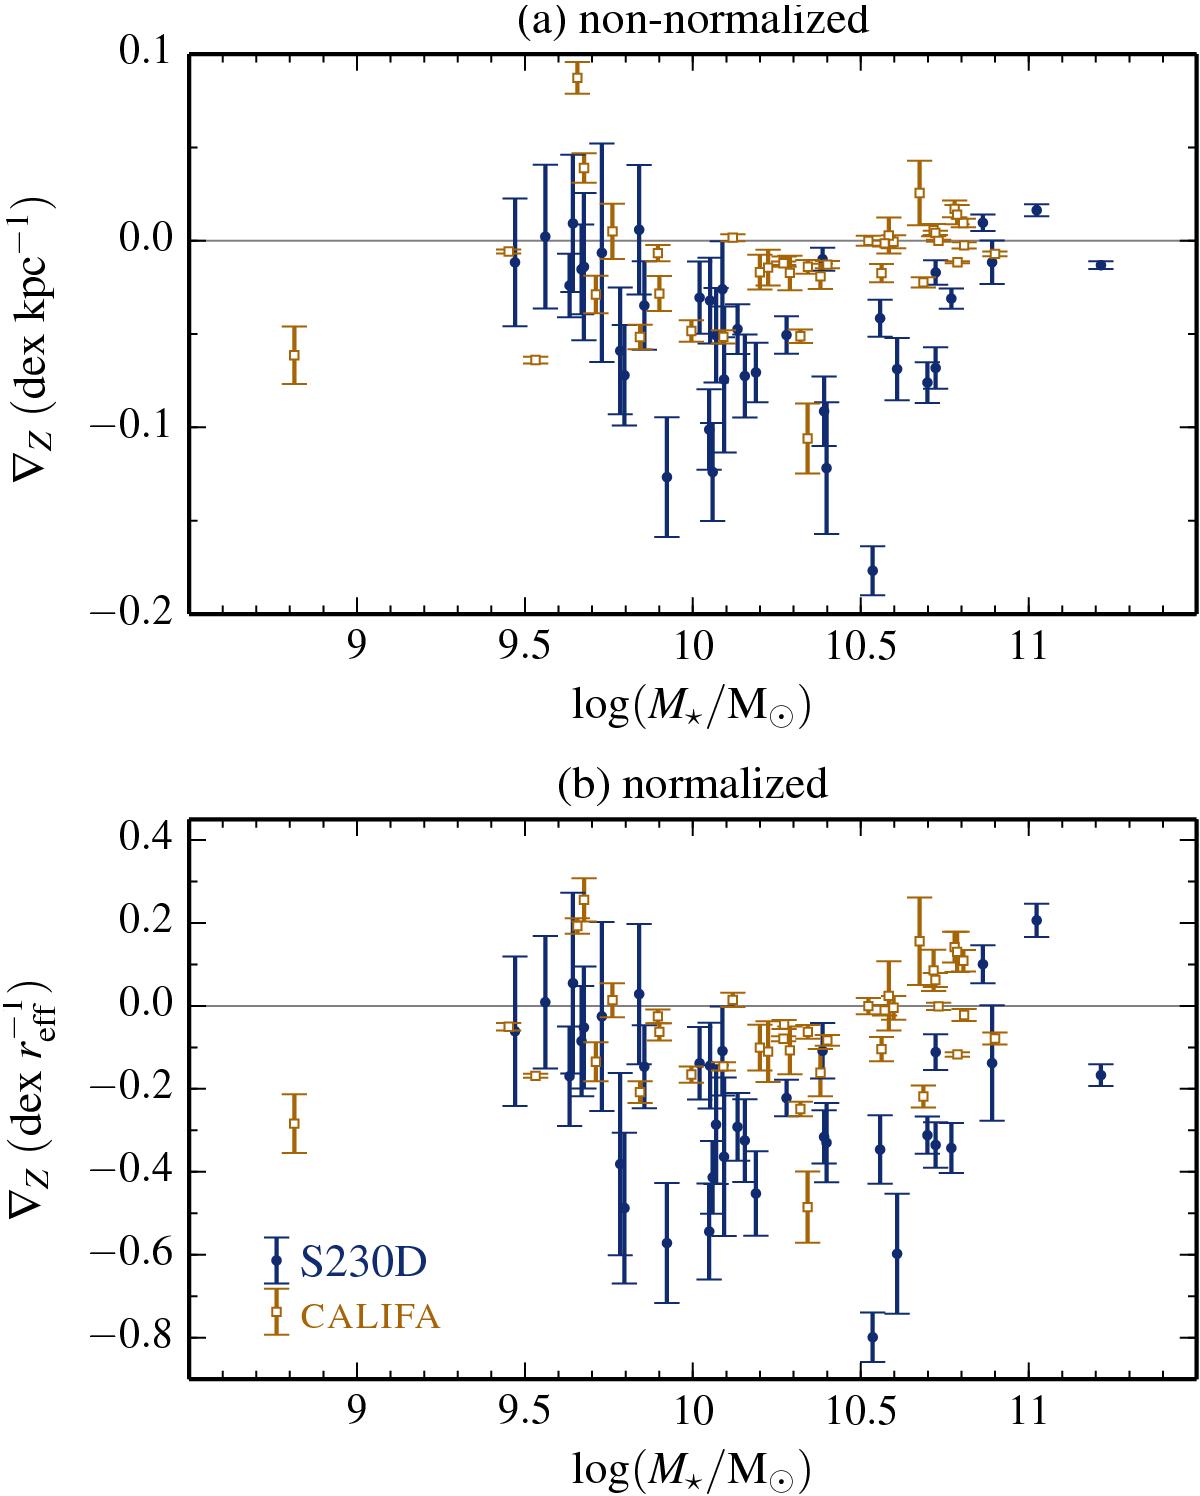
Slopes of the non-normalized (upper panel) and normalized (lower panel) metallicity gradients of the SPs in the disc components as a function of total stellar mass of the simulated galaxies (solid, blue circles). The error bars correspond to a bootstrap error of the linear regression fits. Observations from the CALIFA survey by (Sánchez-Blázquez et al. 2014; open yellow squares) were included for comparison.
Current usage metrics show cumulative count of Article Views (full-text article views including HTML views, PDF and ePub downloads, according to the available data) and Abstracts Views on Vision4Press platform.
Data correspond to usage on the plateform after 2015. The current usage metrics is available 48-96 hours after online publication and is updated daily on week days.
Initial download of the metrics may take a while.