Fig. 7
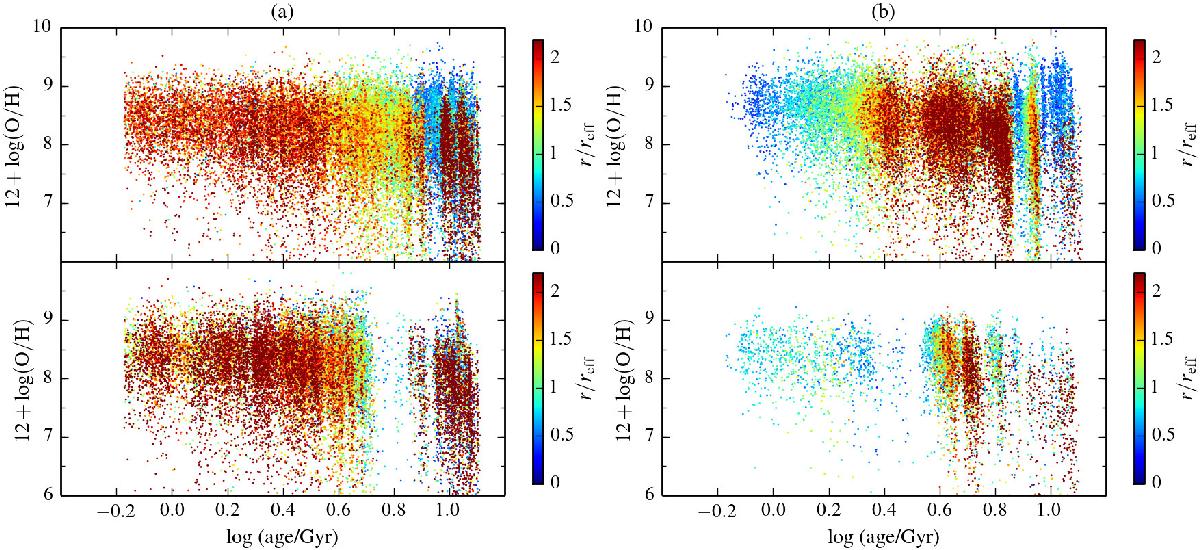
Age-metallicity relation for simulated galaxies: a) negative age gradients (upper-left galaxy: ∇age = −0.41;∇Z = −0.34; lower-left galaxy: ∇age = −0.40;∇Z = −0.14) and b) positive age gradients (upper-right galaxy: ∇age = 0.32;∇Z = −0.34; lower-right galaxy: ∇age = 0.10;∇Z = −0.14). The colours denote the distance to the centre of mass in units of the reff. Each point depicts a star particle representing a single SP. The relation between old and new SPs clearly differs and is responsible for the different age profiles in the simulations.
Current usage metrics show cumulative count of Article Views (full-text article views including HTML views, PDF and ePub downloads, according to the available data) and Abstracts Views on Vision4Press platform.
Data correspond to usage on the plateform after 2015. The current usage metrics is available 48-96 hours after online publication and is updated daily on week days.
Initial download of the metrics may take a while.