Fig. 13
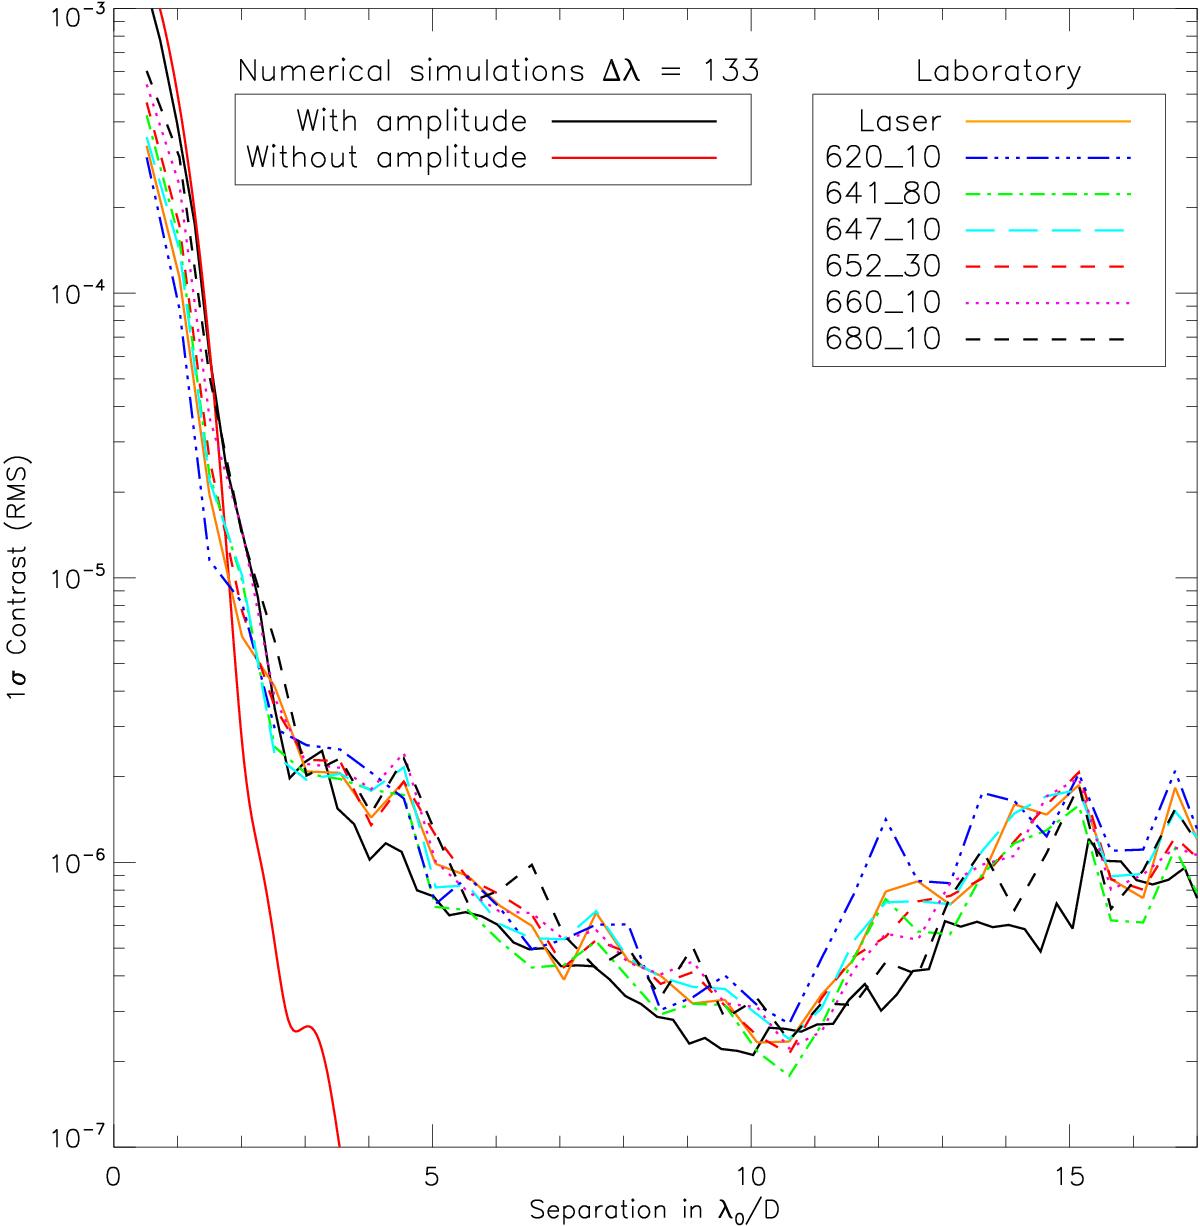
Contrast curves associated with the images obtained in laboratory for the monochromatic light source, the 10 nm bandwidths, and the large bandwidths described in Table 1. Two contrast curves derived from numerical simulations for 133 nm bandwidth are overplotted with no amplitude aberrations (solid red line) and with amplitude aberrations (solid black line).
Current usage metrics show cumulative count of Article Views (full-text article views including HTML views, PDF and ePub downloads, according to the available data) and Abstracts Views on Vision4Press platform.
Data correspond to usage on the plateform after 2015. The current usage metrics is available 48-96 hours after online publication and is updated daily on week days.
Initial download of the metrics may take a while.