Fig. 4
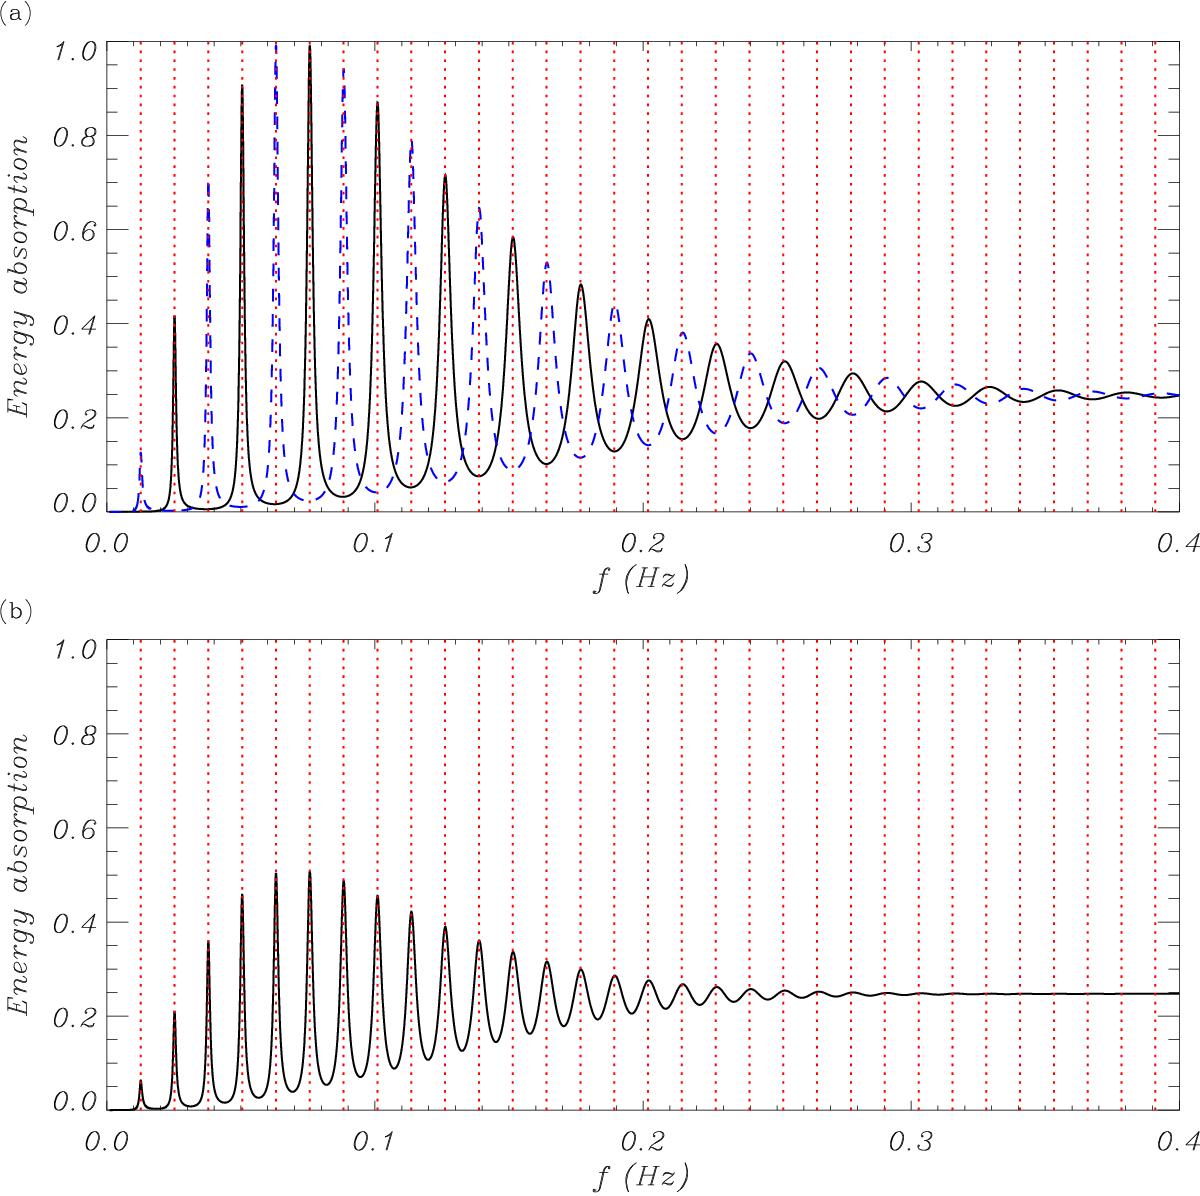
Coefficient of energy absorption, ![]() , as a function of the incident wave frequency (in Hz), f = ω/ 2π. a) Results when the incident waves on both sides of the slab are in phase (I1 = I2, black solid line) and antiphase (I1 = −I2, dashed blue line). b) Results when I2 = I1eiπ/ 2. In both panels, the vertical dotted lines denote the approximate cavity resonance frequencies according to Eq. (45). In all cases we used ξi = 0.2 and the remaining parameters are the same as in Fig. 3.
, as a function of the incident wave frequency (in Hz), f = ω/ 2π. a) Results when the incident waves on both sides of the slab are in phase (I1 = I2, black solid line) and antiphase (I1 = −I2, dashed blue line). b) Results when I2 = I1eiπ/ 2. In both panels, the vertical dotted lines denote the approximate cavity resonance frequencies according to Eq. (45). In all cases we used ξi = 0.2 and the remaining parameters are the same as in Fig. 3.
Current usage metrics show cumulative count of Article Views (full-text article views including HTML views, PDF and ePub downloads, according to the available data) and Abstracts Views on Vision4Press platform.
Data correspond to usage on the plateform after 2015. The current usage metrics is available 48-96 hours after online publication and is updated daily on week days.
Initial download of the metrics may take a while.