Fig. 8
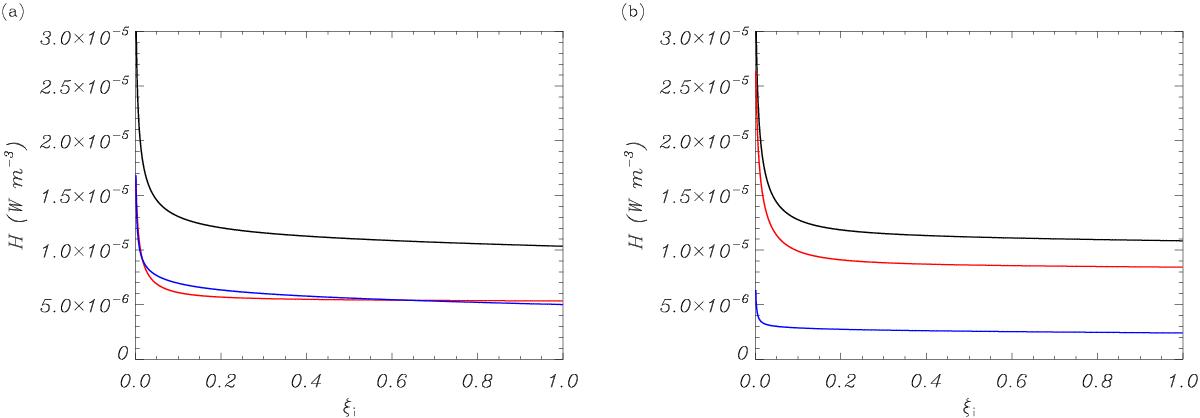
a) Total integrated heating, H, as a function of the hydrogen ionization ratio, ξi, when the velocity amplitude of the incident waves is 10 km s-1. The black line indicates the full result, the red line indicates the contribution of short periods (0.1 s ≤ P ≤ 1 s), and the blue line indicates the contribution of intermediate periods (1 s ≤ P ≤ 100 s). b) Same as panel a) but for the velocity power law of Hillier et al. (2013).
Current usage metrics show cumulative count of Article Views (full-text article views including HTML views, PDF and ePub downloads, according to the available data) and Abstracts Views on Vision4Press platform.
Data correspond to usage on the plateform after 2015. The current usage metrics is available 48-96 hours after online publication and is updated daily on week days.
Initial download of the metrics may take a while.