Fig. 2
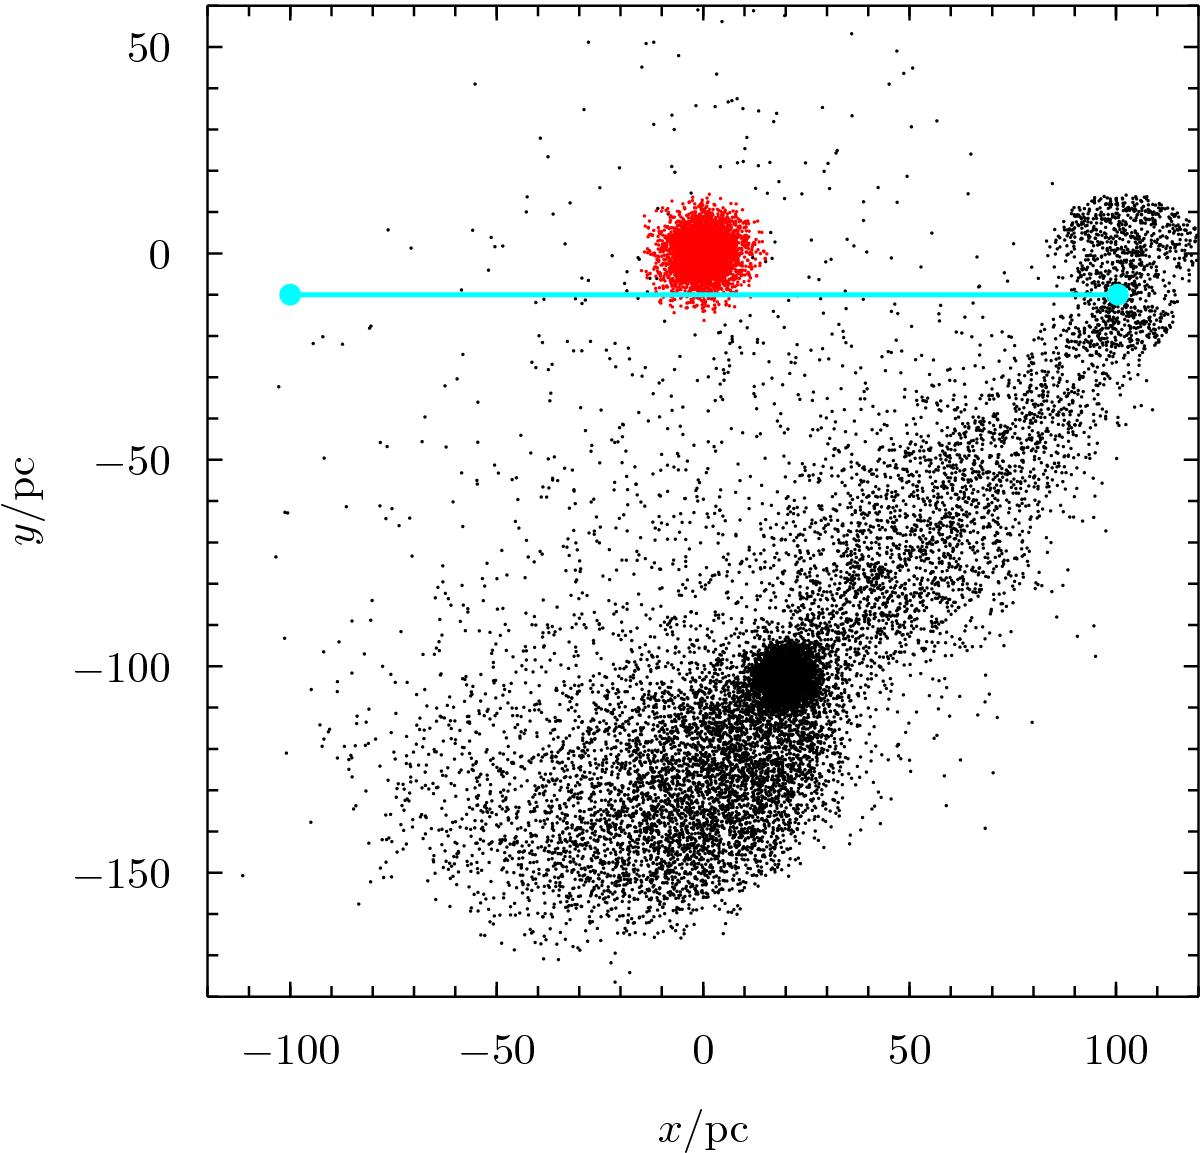
Positions of stars projected onto the cloud-cluster orbit plane in one of our cluster-destruction simulations. Red/grey dots show the initial positions of stars in our model cluster. Black dots show the positions of stars at a time of 20 Myr, just before the GMC is removed from this simulation; i.e. at the end of step one of the two-step process described in Sect. 5.2. Positions are plotted in the frame in which the cluster centre of mass is initially at rest. Horizontal line shows the motion of the GMC in this frame from left to right, with the end points showing its position at the times when it is inserted and removed, and the encircling dashed line its half-mass radius. The star cluster in this example simulation had an initial half-mass radius rh,i = 2 pc and interacted with a cloud of mass M = 3 × 10⁵ M⊙ and half-mass radius of 5 pc, moving at a relative velocity at infinity of V0 = 10 km s-1. The impact parameter was b = 10 pc.
Current usage metrics show cumulative count of Article Views (full-text article views including HTML views, PDF and ePub downloads, according to the available data) and Abstracts Views on Vision4Press platform.
Data correspond to usage on the plateform after 2015. The current usage metrics is available 48-96 hours after online publication and is updated daily on week days.
Initial download of the metrics may take a while.