Fig. 10
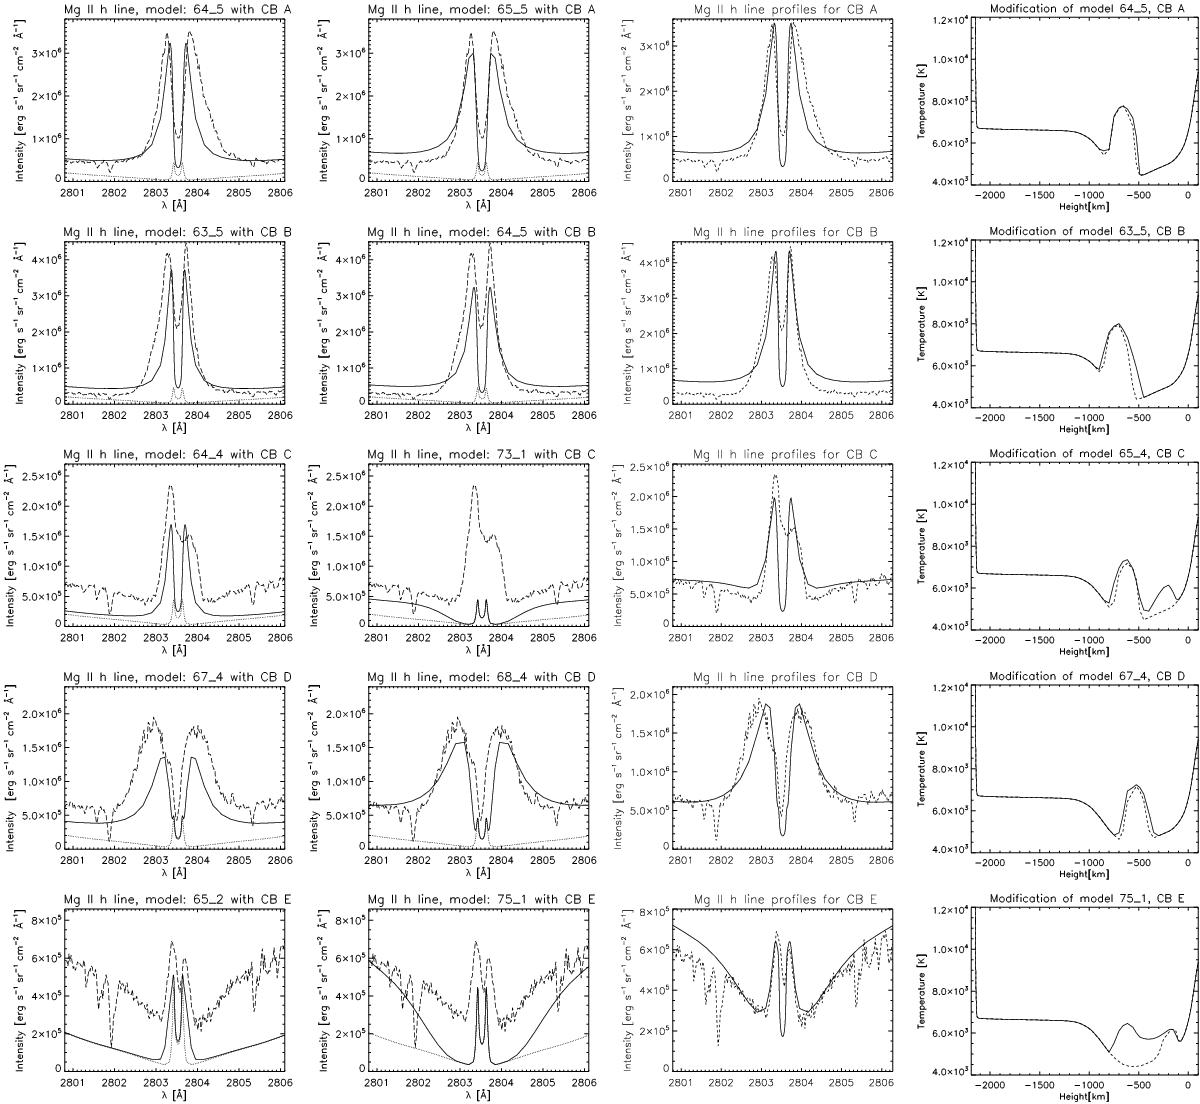
Plots with the results of modelling. The first two left columns show some synthetic profiles (solid line) compared with observational profiles (dashed line) for best models from the grid. Some of the profiles are chosen from method based on profiles parameters, some of them have additional profile chosen after visual verification (63-5 for B, 73-1 for C, 68-4 for D, 75-1 for E). The third column presents the synthetic profiles (solid line) obtained from modified models compared with observational profiles (dashed line). In the last, right column, we present the temperature structure of the best models plotted with a black solid line. The dashed line represents models before modification. In this figure, each row corresponds to other compact brightening from A to E, respectively.
Current usage metrics show cumulative count of Article Views (full-text article views including HTML views, PDF and ePub downloads, according to the available data) and Abstracts Views on Vision4Press platform.
Data correspond to usage on the plateform after 2015. The current usage metrics is available 48-96 hours after online publication and is updated daily on week days.
Initial download of the metrics may take a while.