Fig. 2
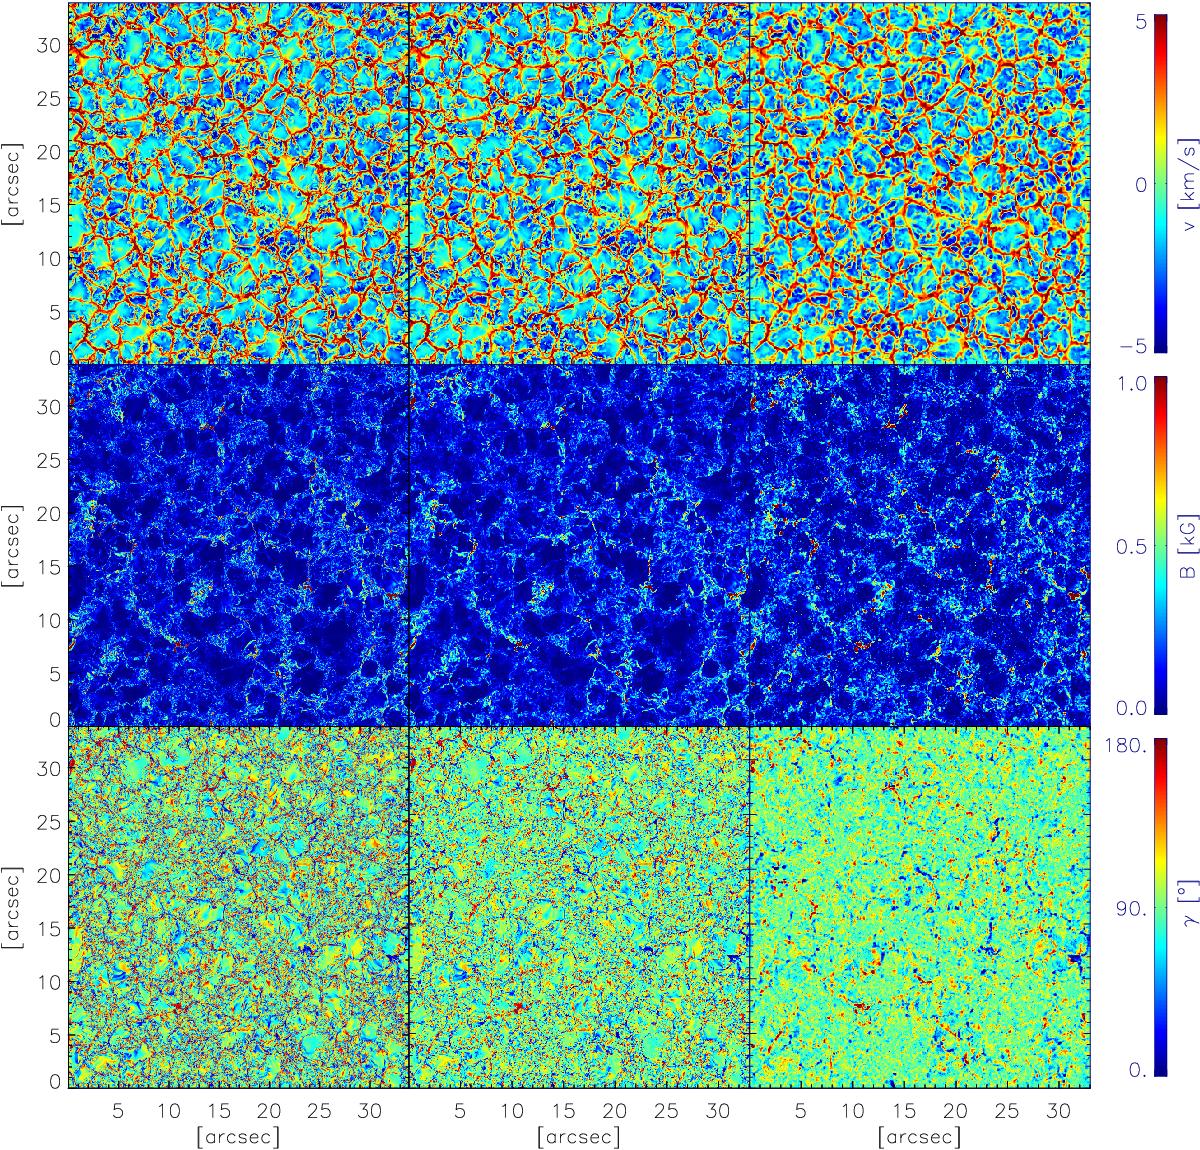
Results of 2D inversions applied to simulations; comparison of maps of velocity (top row), magnetic field strength (middle row) and inclination (bottom row) at log τ = 0 in Sim 2. Three columns, from left to right, show the original unsmeared maps from the snapshot, the same maps after the highest spatial frequencies are filtered out, and the results from the inversions.
Current usage metrics show cumulative count of Article Views (full-text article views including HTML views, PDF and ePub downloads, according to the available data) and Abstracts Views on Vision4Press platform.
Data correspond to usage on the plateform after 2015. The current usage metrics is available 48-96 hours after online publication and is updated daily on week days.
Initial download of the metrics may take a while.