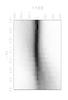
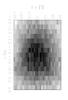
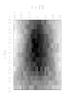
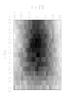
Fig. 3
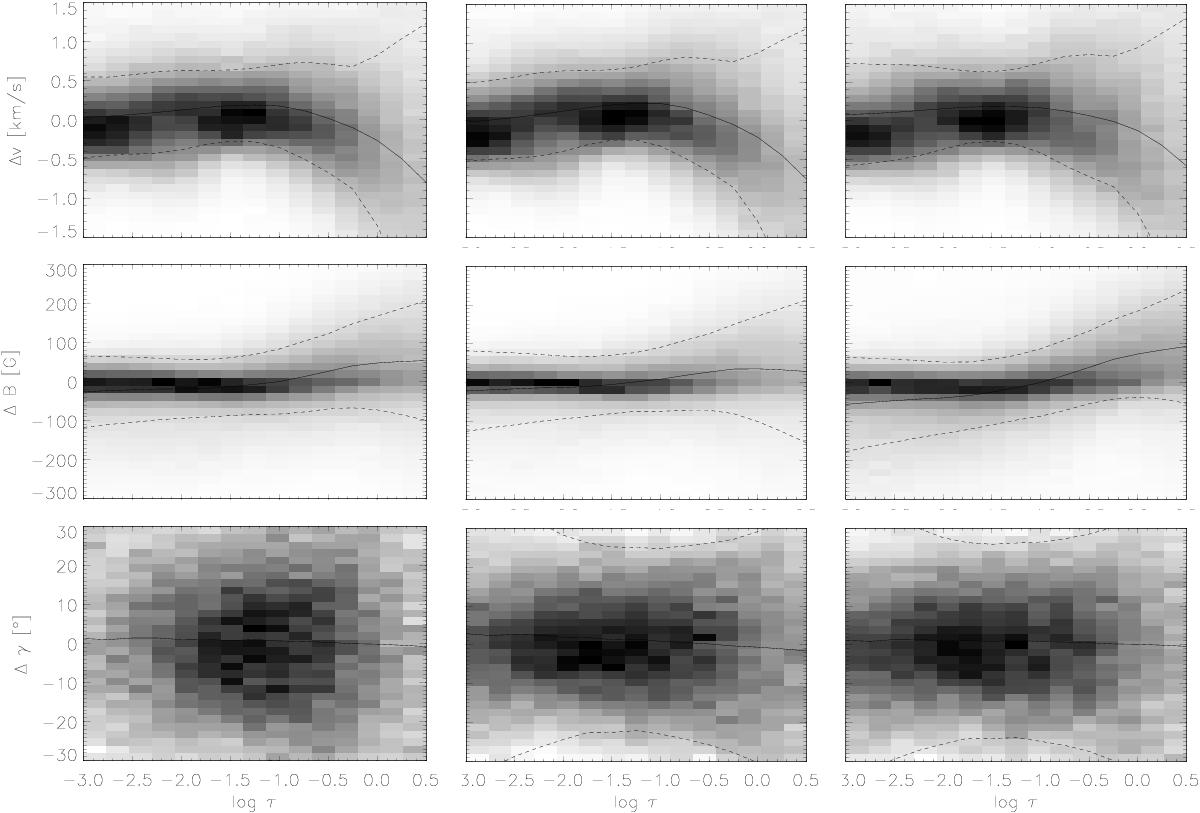
Results of 2D inversions applied to simulations; test of node position in Sim 1 when the top node is placed at log τ = −1.5 (left column), log τ = −2.0 (middle column), and log τ = −2.5 (right column). Two-dimensional histograms of the difference of the original smeared and inverted quantities: magnetic field (top), LOS velocity (middle), and inclination (bottom) as a function of optical depth. The mean difference is indicated by solid lines and the standard deviation of the scatter is indicated by the dashed.


Current usage metrics show cumulative count of Article Views (full-text article views including HTML views, PDF and ePub downloads, according to the available data) and Abstracts Views on Vision4Press platform.
Data correspond to usage on the plateform after 2015. The current usage metrics is available 48-96 hours after online publication and is updated daily on week days.
Initial download of the metrics may take a while.