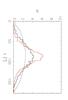
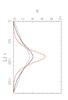
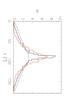
Fig. 5
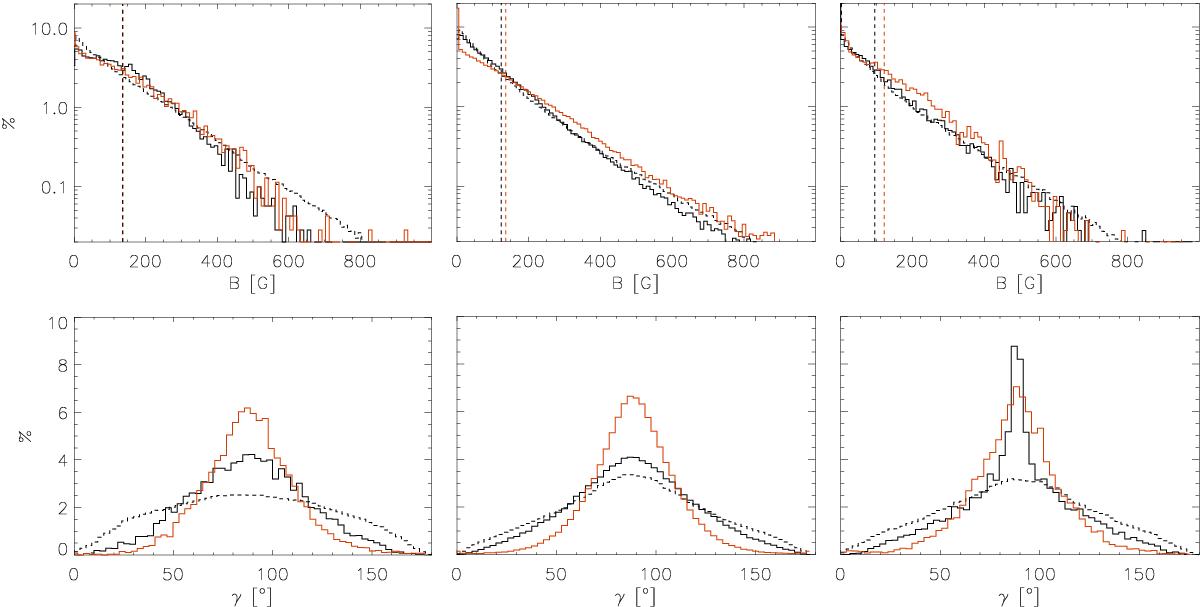
Results of 2D inversions applied to simulations; test on different simulations: histograms of magnetic field strength (top row) and inclination (bottom row) at log τ = 0 for Sim 1, 2, and 3 from left to right. Black dashed and solid lines indicate the original distributions before and after the spatial smearing, respectively. Red line shows distributions retrieved with 2D inversions. Bin sizes are 10 G and 3°. Vertical lines indicate the corresponding mean field strengths at log τ = 0: from the original when the highest spatial frequencies are filtered out (black dashed line) and retrieved with inversions (red dashed line).
Current usage metrics show cumulative count of Article Views (full-text article views including HTML views, PDF and ePub downloads, according to the available data) and Abstracts Views on Vision4Press platform.
Data correspond to usage on the plateform after 2015. The current usage metrics is available 48-96 hours after online publication and is updated daily on week days.
Initial download of the metrics may take a while.