Fig. 1
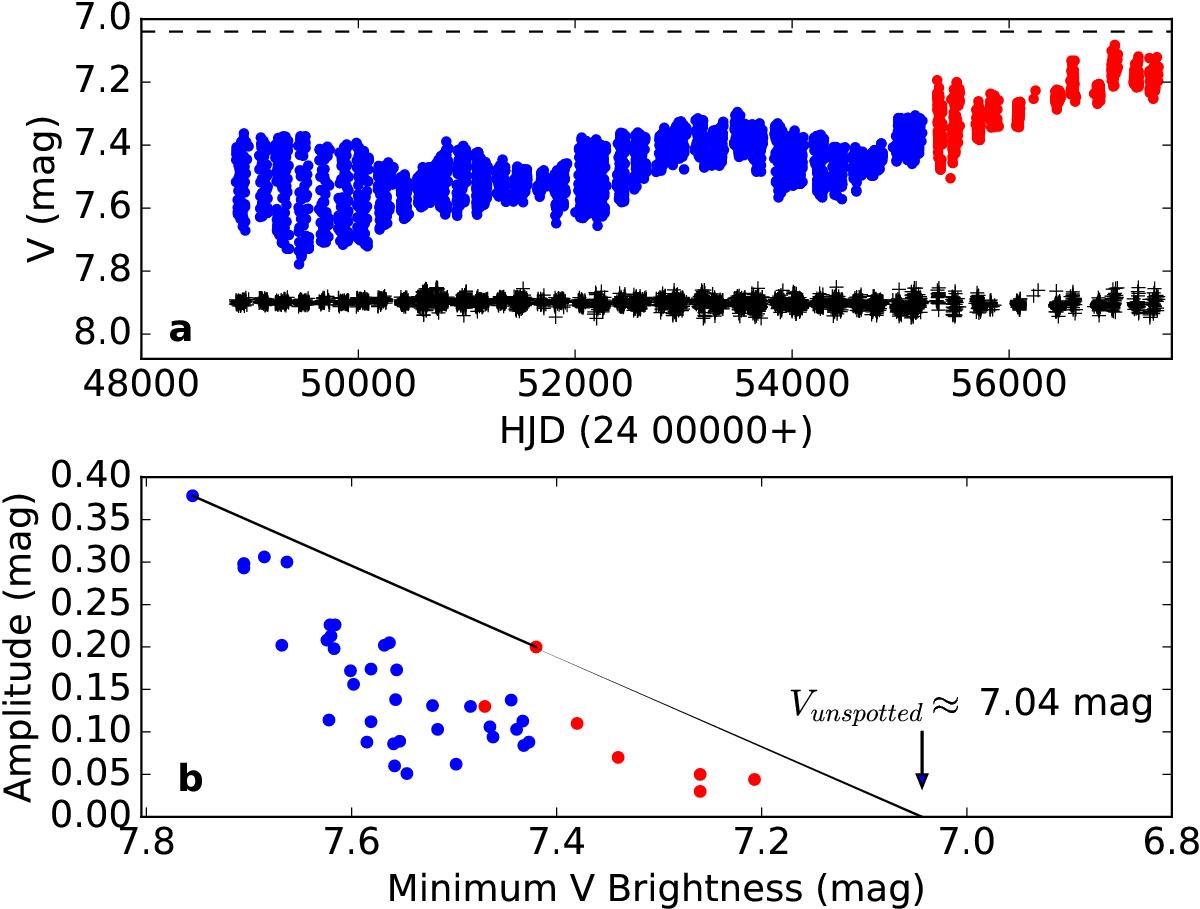
a) Long-term V-band photometry of HD 208472. The dashed line denotes the updated unspotted brightness level. The blue filled dots show data from Paper I, while the red dots denote the recent data. Plus signs show differential magnitudes in the sense of check-minus-comparison star. These measurements are shifted by a constant amount and plotted on a common scale with measurements of the variable star. b) Minimum brightness vs. V amplitude diagram. The straight line is a linear representation of the upper envelope of the scatter.
Current usage metrics show cumulative count of Article Views (full-text article views including HTML views, PDF and ePub downloads, according to the available data) and Abstracts Views on Vision4Press platform.
Data correspond to usage on the plateform after 2015. The current usage metrics is available 48-96 hours after online publication and is updated daily on week days.
Initial download of the metrics may take a while.