Fig. 9
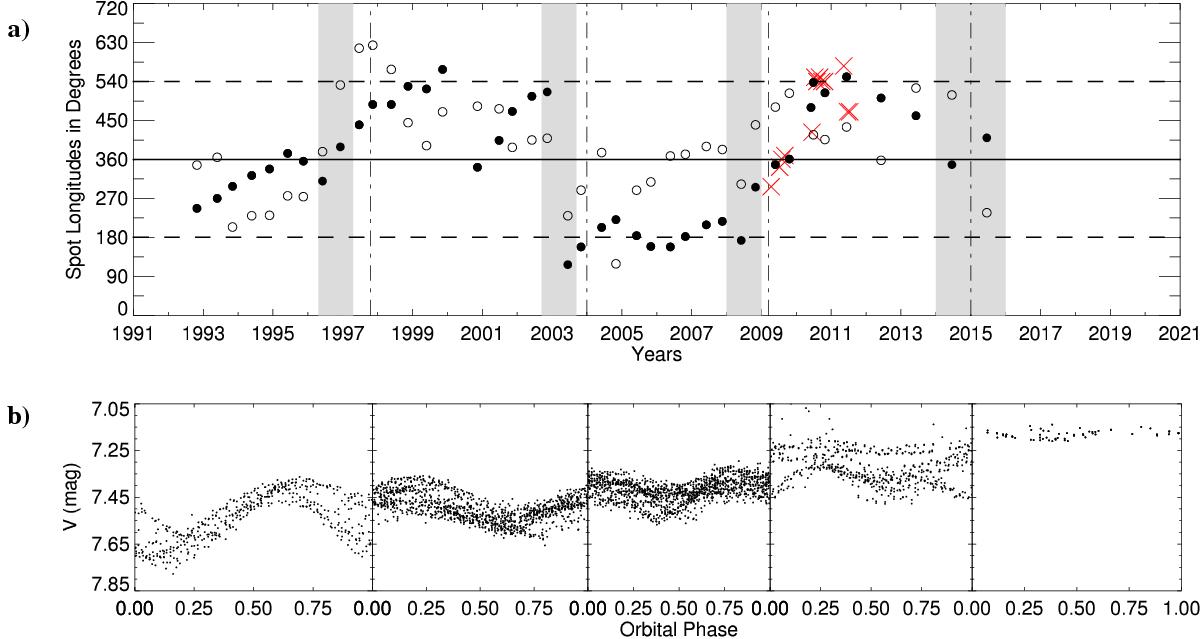
a) Longitudinal distribution of spots on HD 208472 from photometric two-spot models. The shaded regions are the time ranges where spots change their preferential positions (hemispheres) on the surface of the star. The continuous line represents the longitudes of the apsidal line of the binary system, while the two dashed lines restrict the stellar surface. The vertical dot-dashed lines correspond to times when changes occurred in light-curve amplitude and photometric period. We overplot the longitudes of the main spot of the Doppler images with cross symbols in red. b) Accumulated V brightness phased with the ephemeris in Eq. (1), and separated into the corresponding time intervals in panel a).
Current usage metrics show cumulative count of Article Views (full-text article views including HTML views, PDF and ePub downloads, according to the available data) and Abstracts Views on Vision4Press platform.
Data correspond to usage on the plateform after 2015. The current usage metrics is available 48-96 hours after online publication and is updated daily on week days.
Initial download of the metrics may take a while.