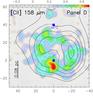
Fig. 1
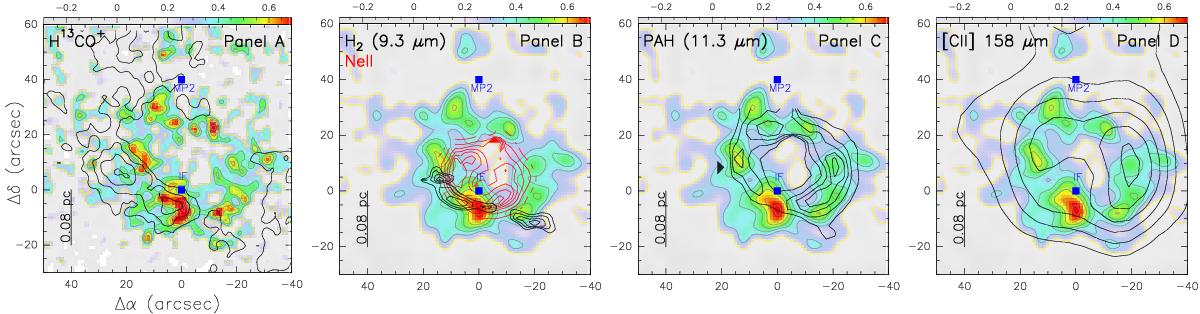
Integrated emission (in K km s-1) of the CO+ line with the original (11′′, panel A)) and smoothed (16′′, panels B) to D)) angular resolution. In panels A) to D), the gray contour levels range from 40% to 100% in steps of 10% of the intensity peak, where the lower contour level corresponds to a S/N = 5σ. The yellow contour indicates the 3σ emission. The blue squares indicate the IF and MP2 positions, where IF corresponds to α(J2000) = 06h07m46.2s, δ(J2000) = −06°23′08.3′′. panel A) shows the H13CO+ (3−2) emission (black contours) tracing the molecular gas (Treviño-Morales et al. 2014). Panel B) shows the [Ne ii] emission (red contours) tracing the Hii region and the emission of the H2 S(3) rotational line at 9.7 μm (black contours). Black contours in panel C) show the PAHs (11.3 μm) emission. Panel D) shows the [Cii] emission at 158 μm (black contours; Pilleri et al. 2014). The Spitzer data are explained in Berné et al. (2009).
Current usage metrics show cumulative count of Article Views (full-text article views including HTML views, PDF and ePub downloads, according to the available data) and Abstracts Views on Vision4Press platform.
Data correspond to usage on the plateform after 2015. The current usage metrics is available 48-96 hours after online publication and is updated daily on week days.
Initial download of the metrics may take a while.