Fig. 2
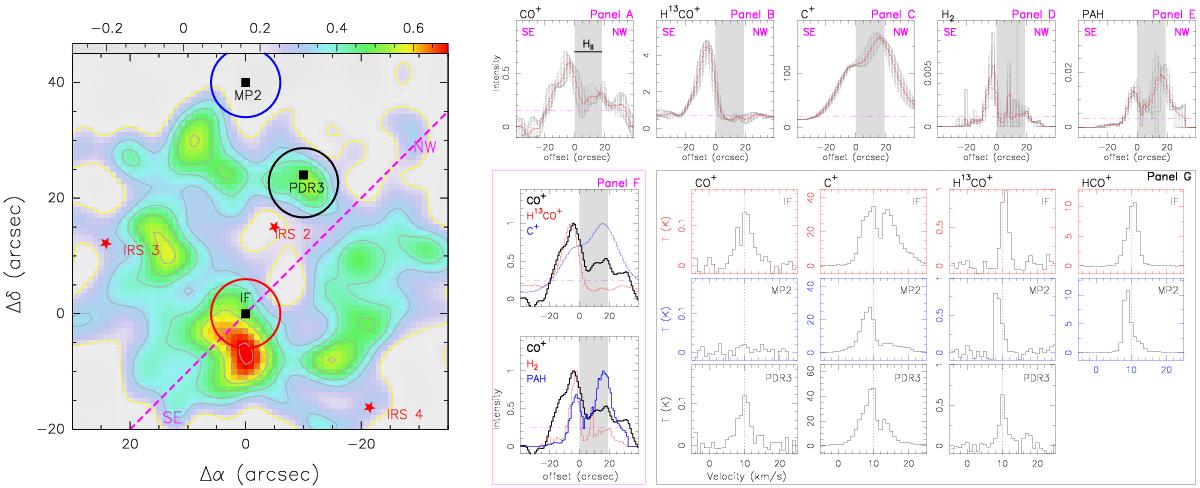
Left: CO+ integrated emission (see Fig. 1). The pink dashed line indicates the direction of the intensity cuts. The colored circles indicate the positions where spectra were extracted. Right: panel A) to E) show the intensity cuts (red continuum lines) of CO+, H13CO+, [Cii], H2, and PAHs. In these panels, the gray continuum lines indicates the errors in the cuts. Panel F) shows the comparison of the intensity cuts scaled to unity. In panels A) to F), the pink dot-dashed lines indicate the 3σ level for each species and the gray area indicates the position of the UC Hii region. Panel G) shows the CO+, [Cii], H13CO+, and HCO+ spectra at IF, MP2, and PDR3. The color of the boxes are related to these positions (circles in left panel).
Current usage metrics show cumulative count of Article Views (full-text article views including HTML views, PDF and ePub downloads, according to the available data) and Abstracts Views on Vision4Press platform.
Data correspond to usage on the plateform after 2015. The current usage metrics is available 48-96 hours after online publication and is updated daily on week days.
Initial download of the metrics may take a while.