Free Access
Fig. A.1
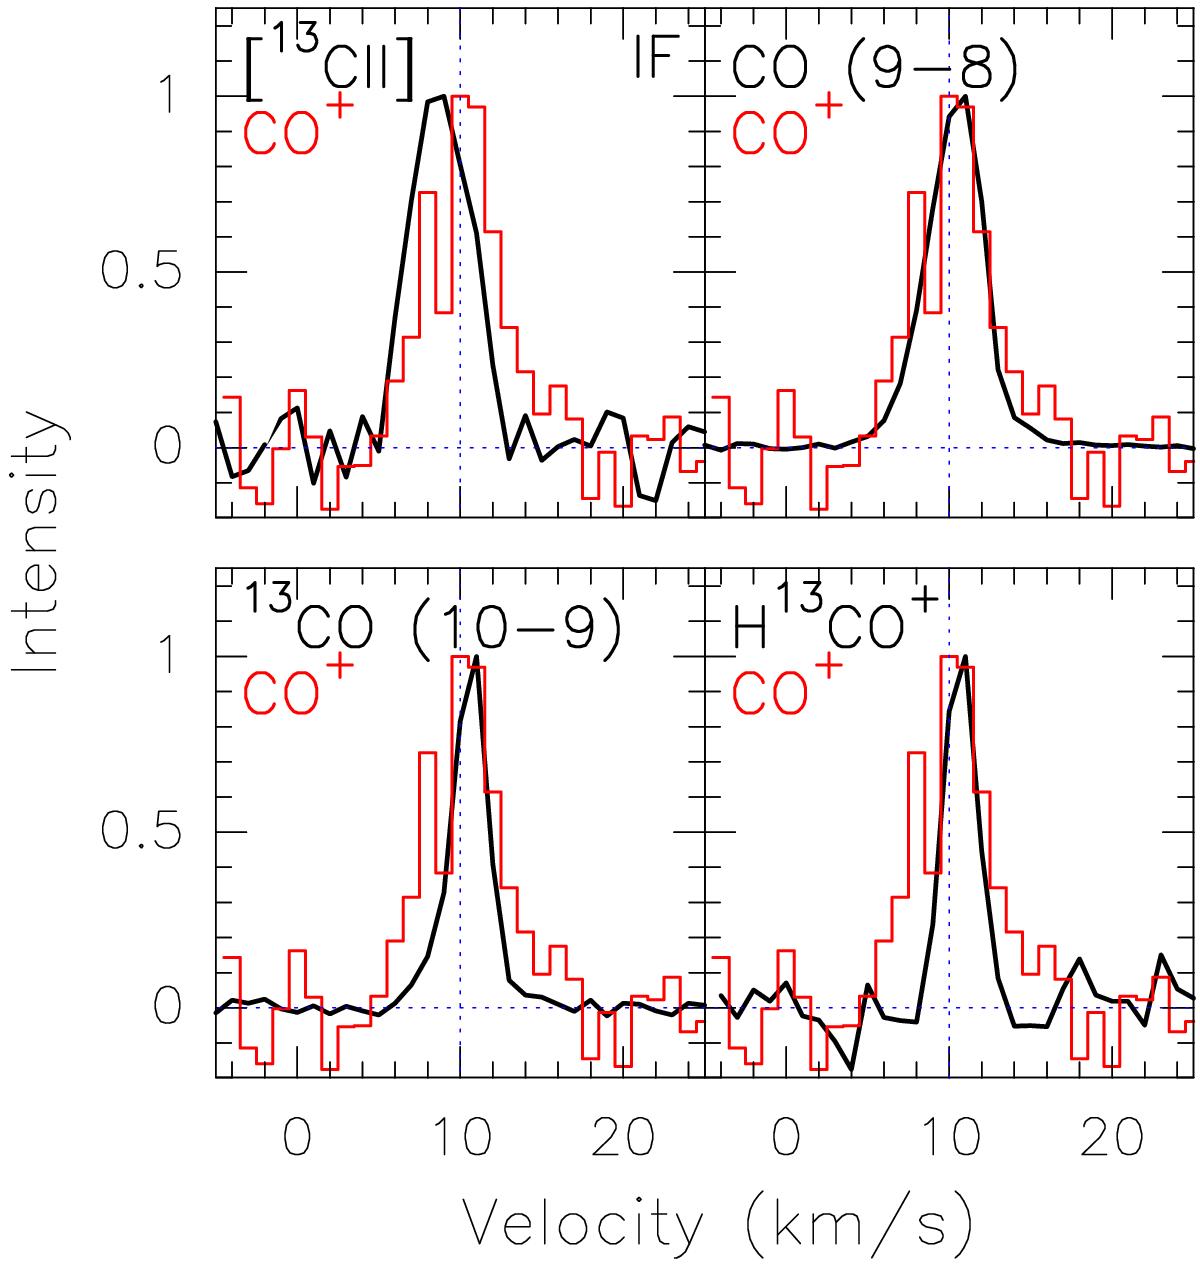
Comparison of the CO+ line profile (in red) with the [13Cii], 13CO (10−9), CO (9−8), and H13CO+ lines (in black) at the IF position, where the intensity is scaled to unity. Herschel data are presented in Pilleri et al. (2012) and Ossenkopf et al. (2013). The blue dotted line indicates the systemic velocity (10 km s-1).
Current usage metrics show cumulative count of Article Views (full-text article views including HTML views, PDF and ePub downloads, according to the available data) and Abstracts Views on Vision4Press platform.
Data correspond to usage on the plateform after 2015. The current usage metrics is available 48-96 hours after online publication and is updated daily on week days.
Initial download of the metrics may take a while.