Fig. 1
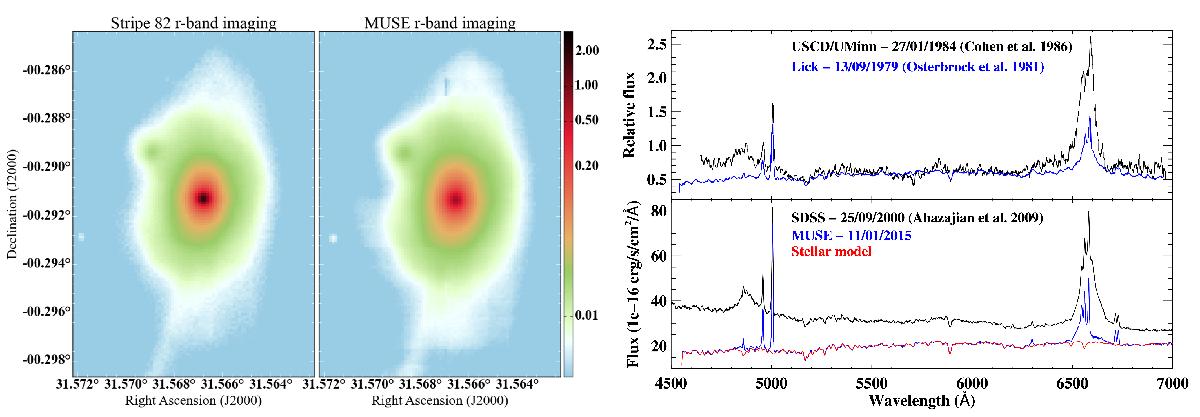
Left: comparison of the stacked Stripe 82 and re-constructed MUSE r band image. The images are scaled logarithmically in units of 10-16 erg s-1 cm-2 Å-1. Right: the top panel shows the original type 1.9 spectrum from 1979 (Osterbrock 1981) and the follow-up type 1 spectrum from 1984 (Cohen et al. 1986) in units of relative flux. These spectra were extracted from the PDFs of the aforementioned papers, and scaled such that their continuum levels and narrow emission lines matched. The bottom panel shows the SDSS spectrum (2000) and a 3′′ aperture spectrum from the MUSE data cube (2015), with the fit to the stellar component of the galaxy overplotted in red.
Current usage metrics show cumulative count of Article Views (full-text article views including HTML views, PDF and ePub downloads, according to the available data) and Abstracts Views on Vision4Press platform.
Data correspond to usage on the plateform after 2015. The current usage metrics is available 48-96 hours after online publication and is updated daily on week days.
Initial download of the metrics may take a while.