Fig. 2
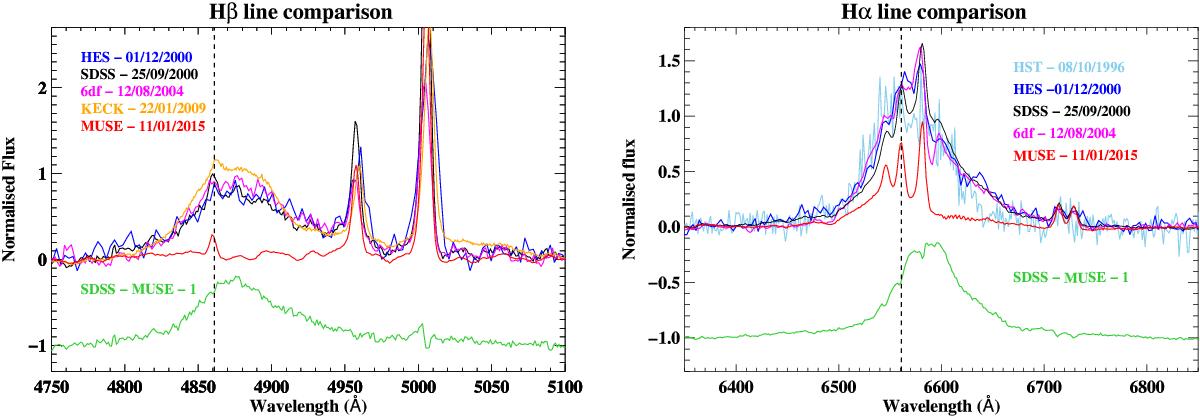
Archival spectra focussed on the Hβ (left panel) and Hα (right panel) emission lines. The spectra are plotted in continuum subtracted normalised flux to account for any discrepancies in flux calibration, units, or aperture size. The systemic redshift of Hα and Hβ based on the narrow emission lines is indicated by the dashed black line. The Keck spectrum from 2009 is plotted in orange and covers only the Hβ line. Residuals of the SDSS spectrum (2000) minus our MUSE spectrum (2014) are plotted in green to emphasise the change in flux and line shape.
Current usage metrics show cumulative count of Article Views (full-text article views including HTML views, PDF and ePub downloads, according to the available data) and Abstracts Views on Vision4Press platform.
Data correspond to usage on the plateform after 2015. The current usage metrics is available 48-96 hours after online publication and is updated daily on week days.
Initial download of the metrics may take a while.