Fig. 1
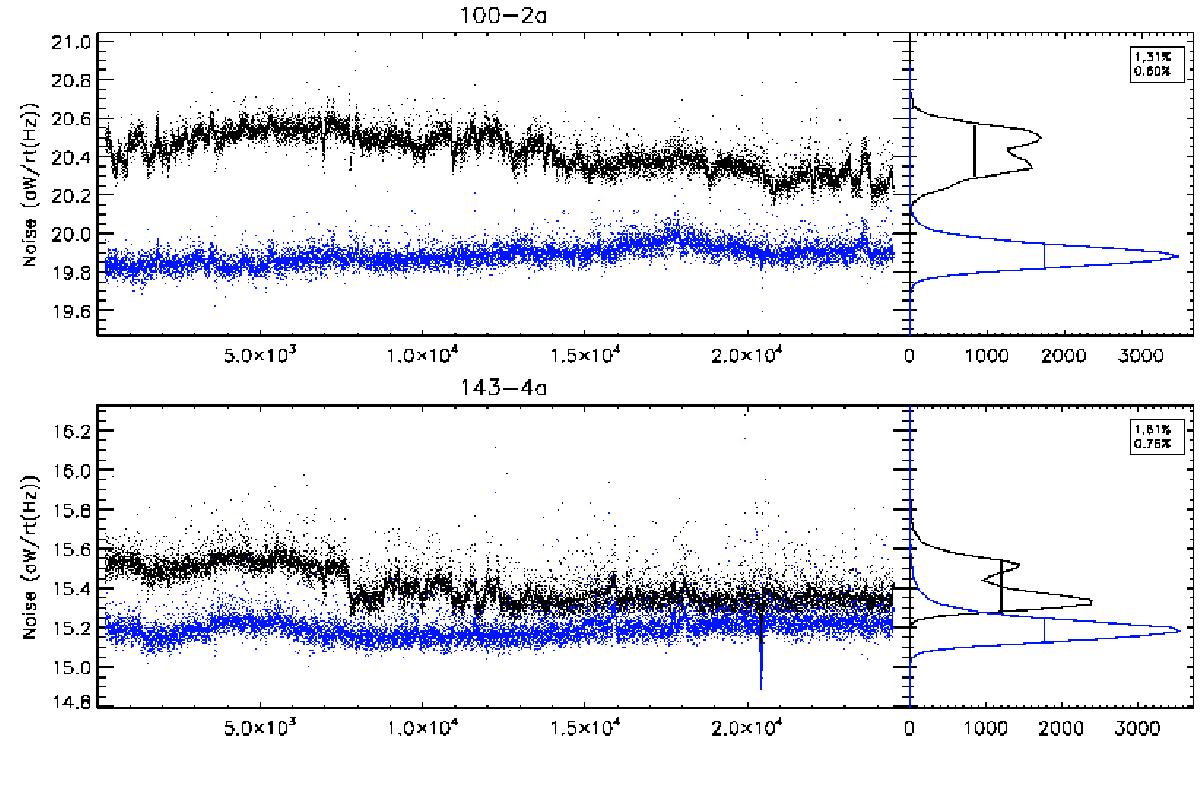
Left panels: noise for two bolometers as a function of ring number. Black dots are from the 2013 data release; blue dots are from the 2015 release. The change in the absolute noise level is due to a change in the time-response deconvolution between the two data releases. Right panels: histograms of the noise. The numbers in the boxes give the width of the histogram at half maximum as a percentage of the mean noise level. For most bolometers, the FWHM in the 2015 release is less than 1% (Planck Collaboration VIII 2016).
Current usage metrics show cumulative count of Article Views (full-text article views including HTML views, PDF and ePub downloads, according to the available data) and Abstracts Views on Vision4Press platform.
Data correspond to usage on the plateform after 2015. The current usage metrics is available 48-96 hours after online publication and is updated daily on week days.
Initial download of the metrics may take a while.