Fig. 12
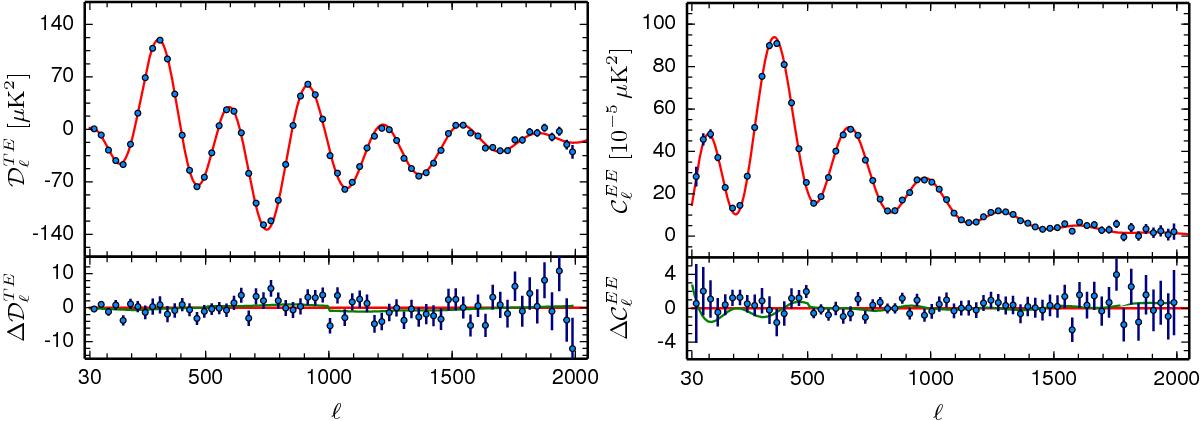
Frequency-averaged TE (left) and EE (right) spectra, not corrected for T-to-P leakage (see text). The theoretical TE and EE spectra plotted in the upper panels are computed from the best-fit model of Fig. 11. Residuals with respect to this theoretical model are shown in the lower panels. The error bars show ±1σ uncertainties. The green lines in the lower panels show the best-fit temperature-to-polarization leakage model, fitted separately to the TE and EE spectra. From Planck Collaboration XIII (2016).
Current usage metrics show cumulative count of Article Views (full-text article views including HTML views, PDF and ePub downloads, according to the available data) and Abstracts Views on Vision4Press platform.
Data correspond to usage on the plateform after 2015. The current usage metrics is available 48-96 hours after online publication and is updated daily on week days.
Initial download of the metrics may take a while.