Fig. 14
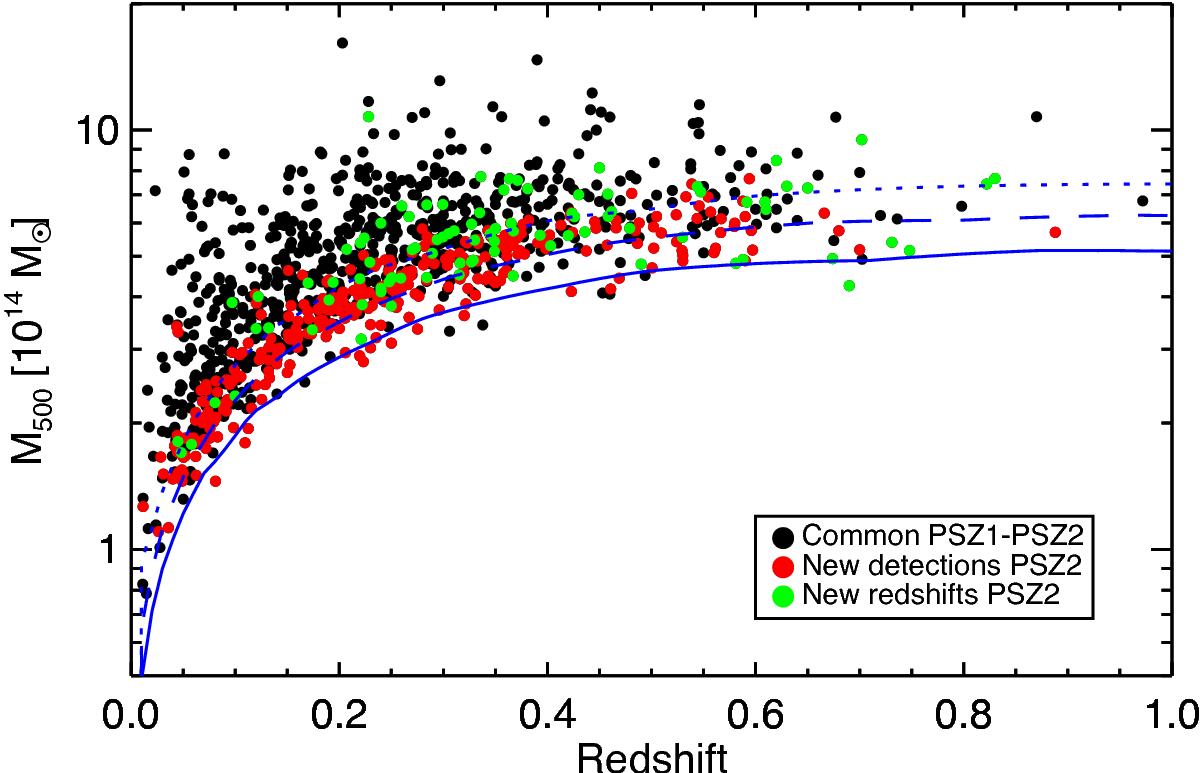
M500–z plane distribution of the 1093 PSZ2 clusters with known redshift. New PSZ2-detected clusters are indicated by red dots, while commmon PSZ1 and PSZ2 clusters are indicated by black dots. Green dots mark the common PSZ2–PSZ1 detections with updated redshifts in PSZ2. The solid, dashed, and dotted lines indicate the limiting mass at 20%, 50%, and 80% survey completeness, respectively.
Current usage metrics show cumulative count of Article Views (full-text article views including HTML views, PDF and ePub downloads, according to the available data) and Abstracts Views on Vision4Press platform.
Data correspond to usage on the plateform after 2015. The current usage metrics is available 48-96 hours after online publication and is updated daily on week days.
Initial download of the metrics may take a while.