Free Access
Fig. 16
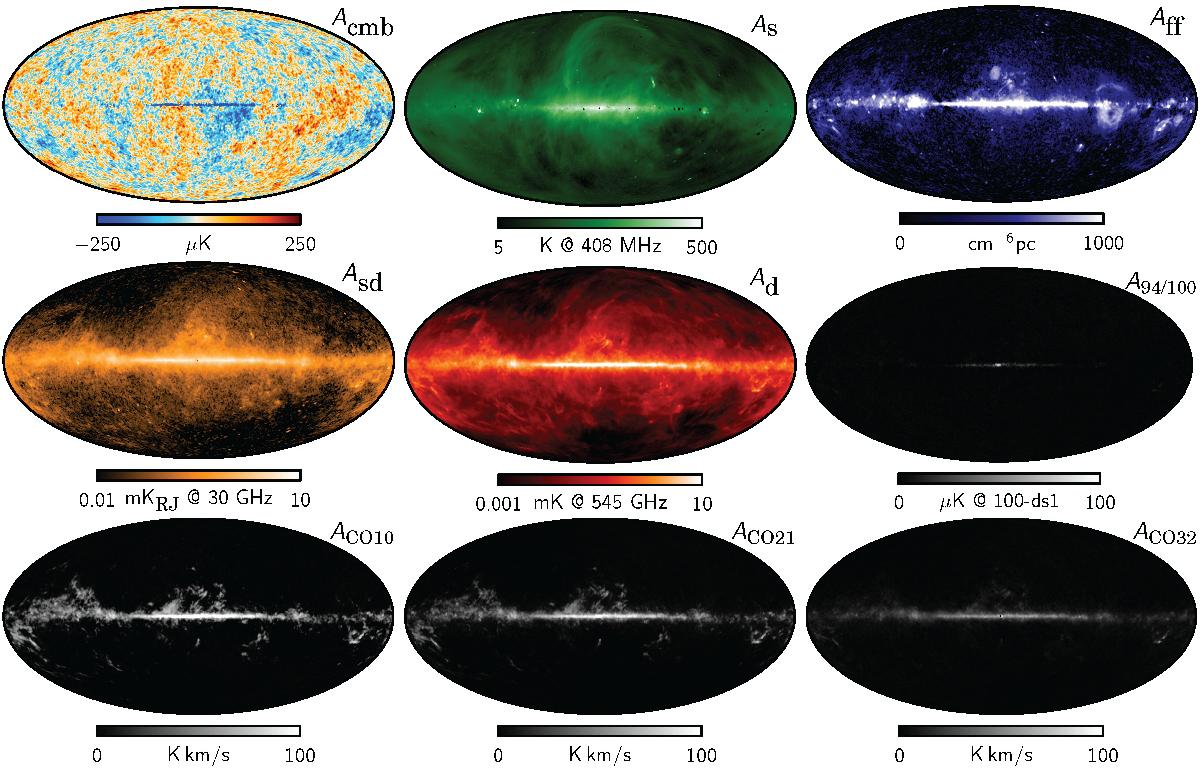
Maximum posterior intensity maps derived from the joint analysis of Planck, WMAP, and 408 MHz observations (Planck Collaboration X 2016). From left to right and top to bottom: CMB; synchrotron; free-free; spinning dust; thermal dust; line emission around 90 GHz; CO J = 1 → 0; CO J = 2 → 1; and CO J = 3 → 2.
Current usage metrics show cumulative count of Article Views (full-text article views including HTML views, PDF and ePub downloads, according to the available data) and Abstracts Views on Vision4Press platform.
Data correspond to usage on the plateform after 2015. The current usage metrics is available 48-96 hours after online publication and is updated daily on week days.
Initial download of the metrics may take a while.