Fig. 19
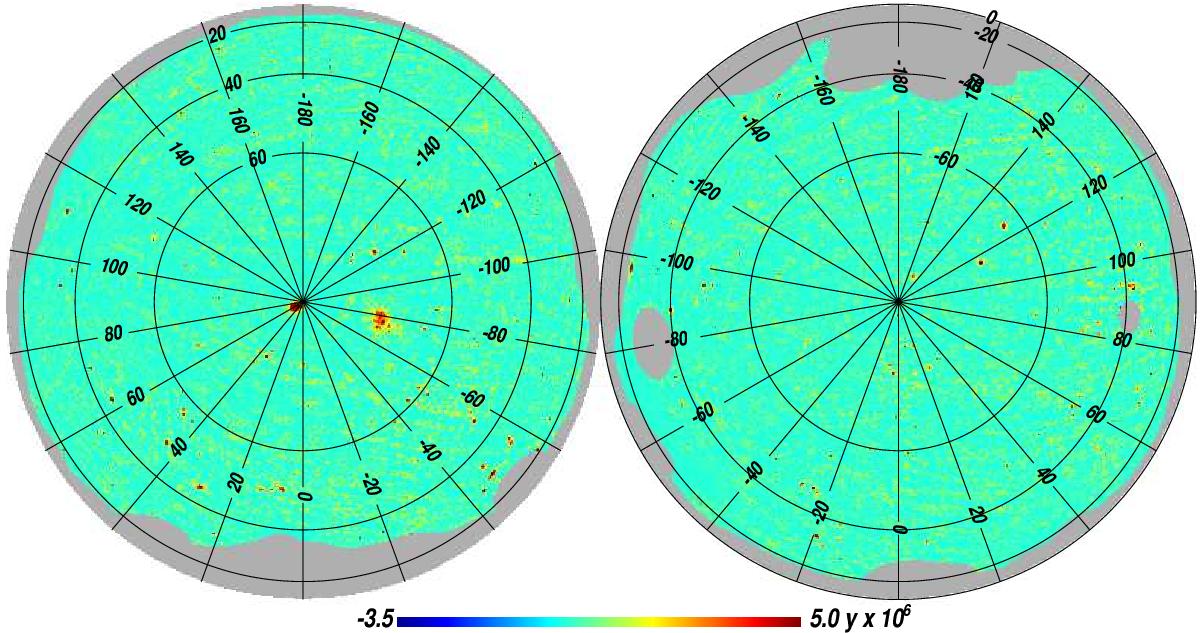
Orthographic projection of the reconstructed Planck all-sky y-map in Compton parameter units (Planck Collaboration XXII 2016). For illustration purposes and to enhance the thermal SZ signal-to-noise ratio, the y-map has been Wiener filtered. Positive sources in the map correspond to clusters and super-clusters of galaxies with strong thermal SZ emission. In particular, the Coma and Virgo clusters are clearly visible near the north Galactic pole. The region of strongest contamination from Galactic foreground emission in the Galactic plane has been partially masked.
Current usage metrics show cumulative count of Article Views (full-text article views including HTML views, PDF and ePub downloads, according to the available data) and Abstracts Views on Vision4Press platform.
Data correspond to usage on the plateform after 2015. The current usage metrics is available 48-96 hours after online publication and is updated daily on week days.
Initial download of the metrics may take a while.