Free Access
Fig. 2
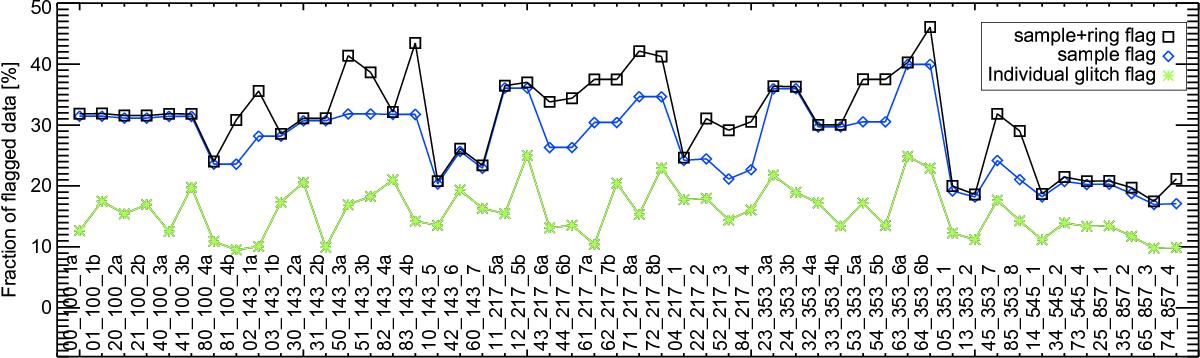
Fraction of discarded data per bolometer due to all causes (black squares), sample flagging alone (blue diamonds) and glitches alone (green diamonds). Bolometers (143_8 and 545_3) are not shown, since they are not used in the data processing (see Planck Collaboration VI 2014).
Current usage metrics show cumulative count of Article Views (full-text article views including HTML views, PDF and ePub downloads, according to the available data) and Abstracts Views on Vision4Press platform.
Data correspond to usage on the plateform after 2015. The current usage metrics is available 48-96 hours after online publication and is updated daily on week days.
Initial download of the metrics may take a while.