Fig. 6
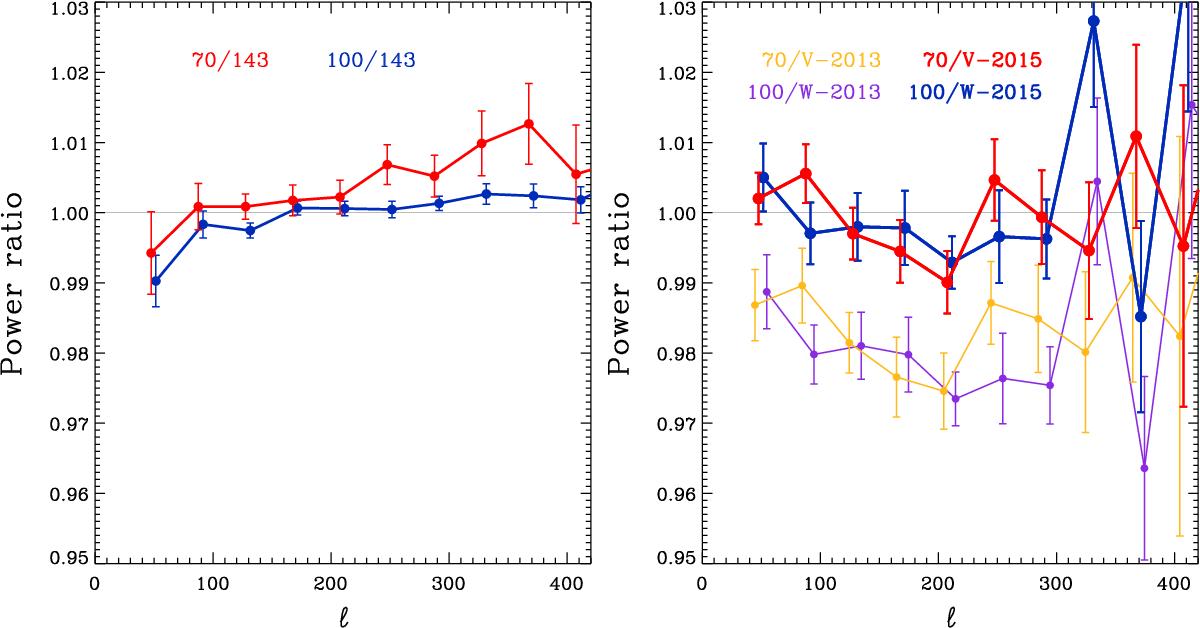
Ratios of power spectra spanning the region of the first acoustic peak, uncorrected for foregrounds (which vary across the three frequencies), over 60% of the sky. The uncertainties are the errors in the mean within each Δℓ = 40 bin of the ratios computed ℓ by ℓ. Left: ratios of 70 and 100 GHz TT spectra to 143 GHz. The low values at ℓ = 50 are due to diffuse foregrounds at 143 GHz. The rise to higher multipoles in the 70/143 ratio is due to discrete foregrounds. Right: ratio of TT spectra of Planck 70 and 100 GHz to WMAP V and W bands, as calculated for Planck 2013 data (Planck Collaboration XXXI 2014) and for the 2015 data. The near overlap of frequencies between the Planck and WMAP bands means that foregrounds have no appreciable effect on the ratios. The effect of the calibration changes in Planck between 2013 and 2015, which are discussed in this paper, is clear. There is now excellent agreement within statistical errors between Planck and WMAP in the region of the spectrum where both have high S/N.
Current usage metrics show cumulative count of Article Views (full-text article views including HTML views, PDF and ePub downloads, according to the available data) and Abstracts Views on Vision4Press platform.
Data correspond to usage on the plateform after 2015. The current usage metrics is available 48-96 hours after online publication and is updated daily on week days.
Initial download of the metrics may take a while.