Fig. A.1
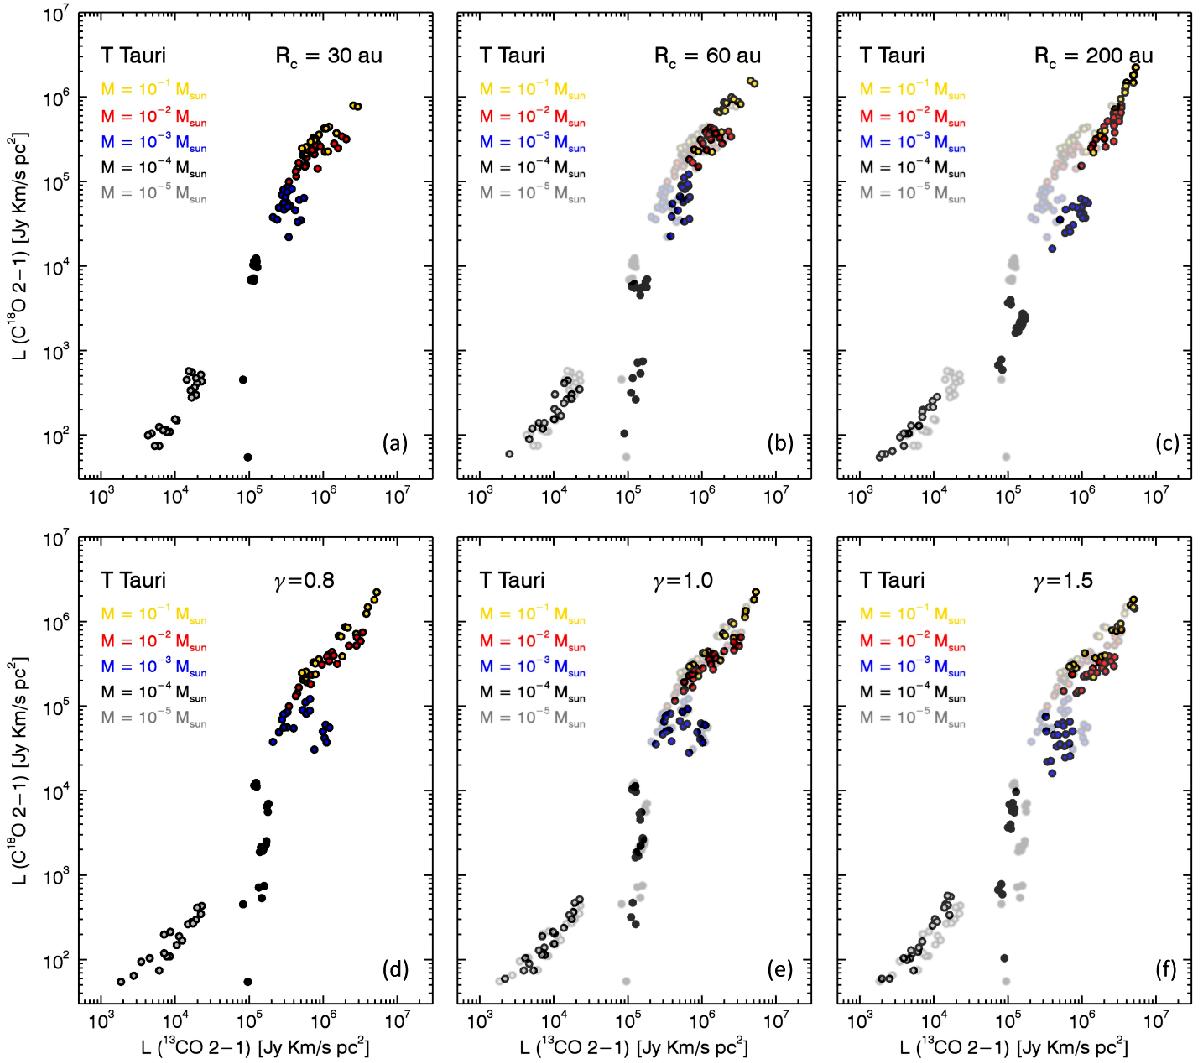
Line luminosity of C18O vs. 13CO (J = 2−1) obtained implementing isotope-selective processes. Different colors represent models with different disk gas masses. In the upper panels models with different values for Rc are presented separately. In the lower panels models with different values for γ are shown separately. Models displayed in panel a) and d) are also reported in gray in panels b), c) and e), f) respectively in order to facilitate the comparison.
Current usage metrics show cumulative count of Article Views (full-text article views including HTML views, PDF and ePub downloads, according to the available data) and Abstracts Views on Vision4Press platform.
Data correspond to usage on the plateform after 2015. The current usage metrics is available 48-96 hours after online publication and is updated daily on week days.
Initial download of the metrics may take a while.