Fig. A.3
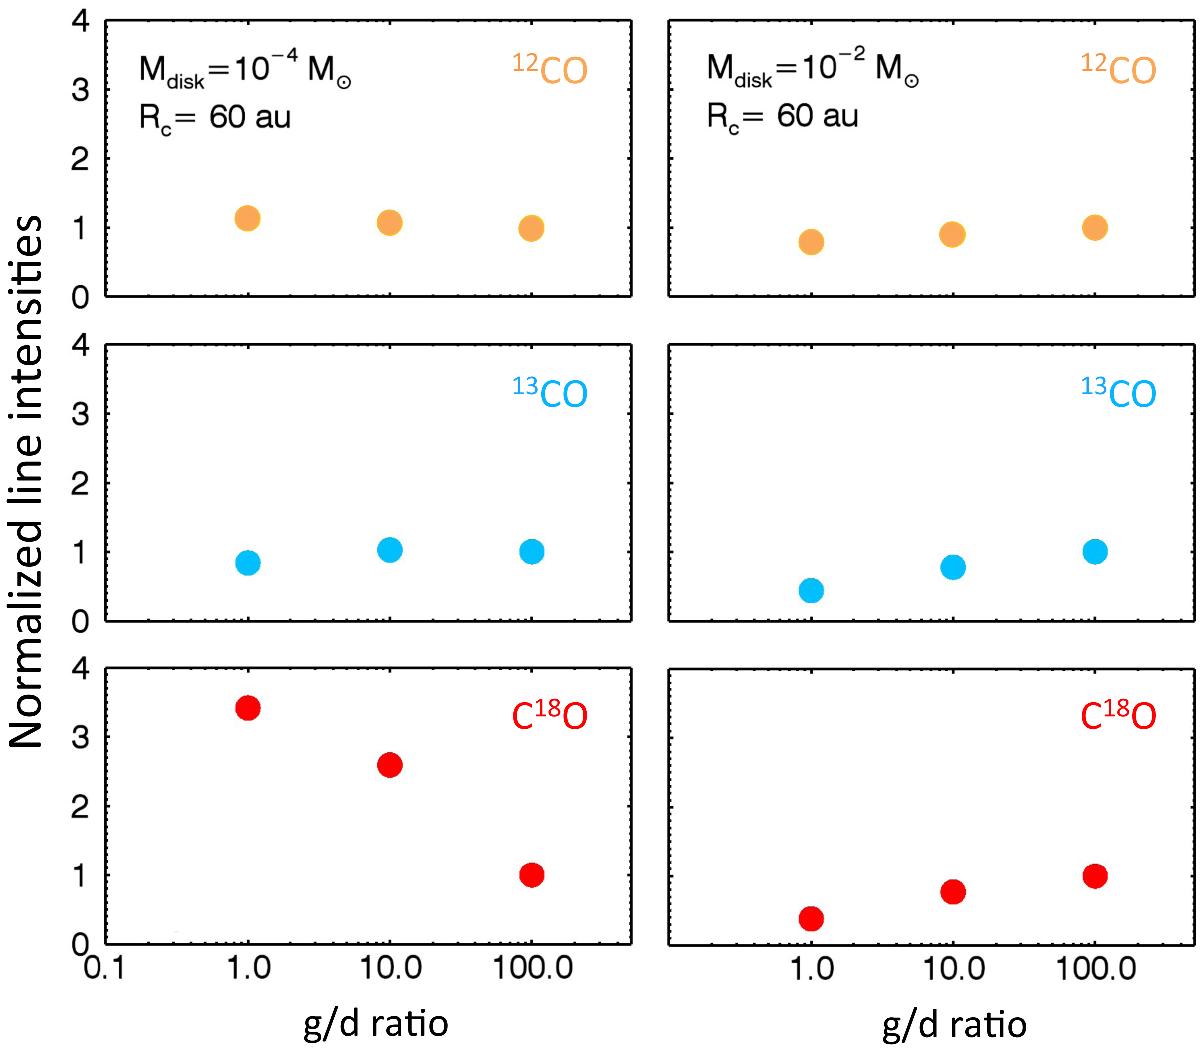
CO isotopologues line intensities normalized by the intensity for gas-to-dust =100 as a function of gas-to-dust ratio. Keeping the gas mass fixed, two T Tauri disk models (Rc = 60 au, γ = 1, ψ = 0.2, hc = 0.2, Mdisk = 10-4, 10-2 M⊙) have been run with gas-to-dust mass ratios of 100, 10 and 1. Orange, blue and red circles show respectively 12CO, 13CO, and C18O lines.
Current usage metrics show cumulative count of Article Views (full-text article views including HTML views, PDF and ePub downloads, according to the available data) and Abstracts Views on Vision4Press platform.
Data correspond to usage on the plateform after 2015. The current usage metrics is available 48-96 hours after online publication and is updated daily on week days.
Initial download of the metrics may take a while.