Fig. B.2
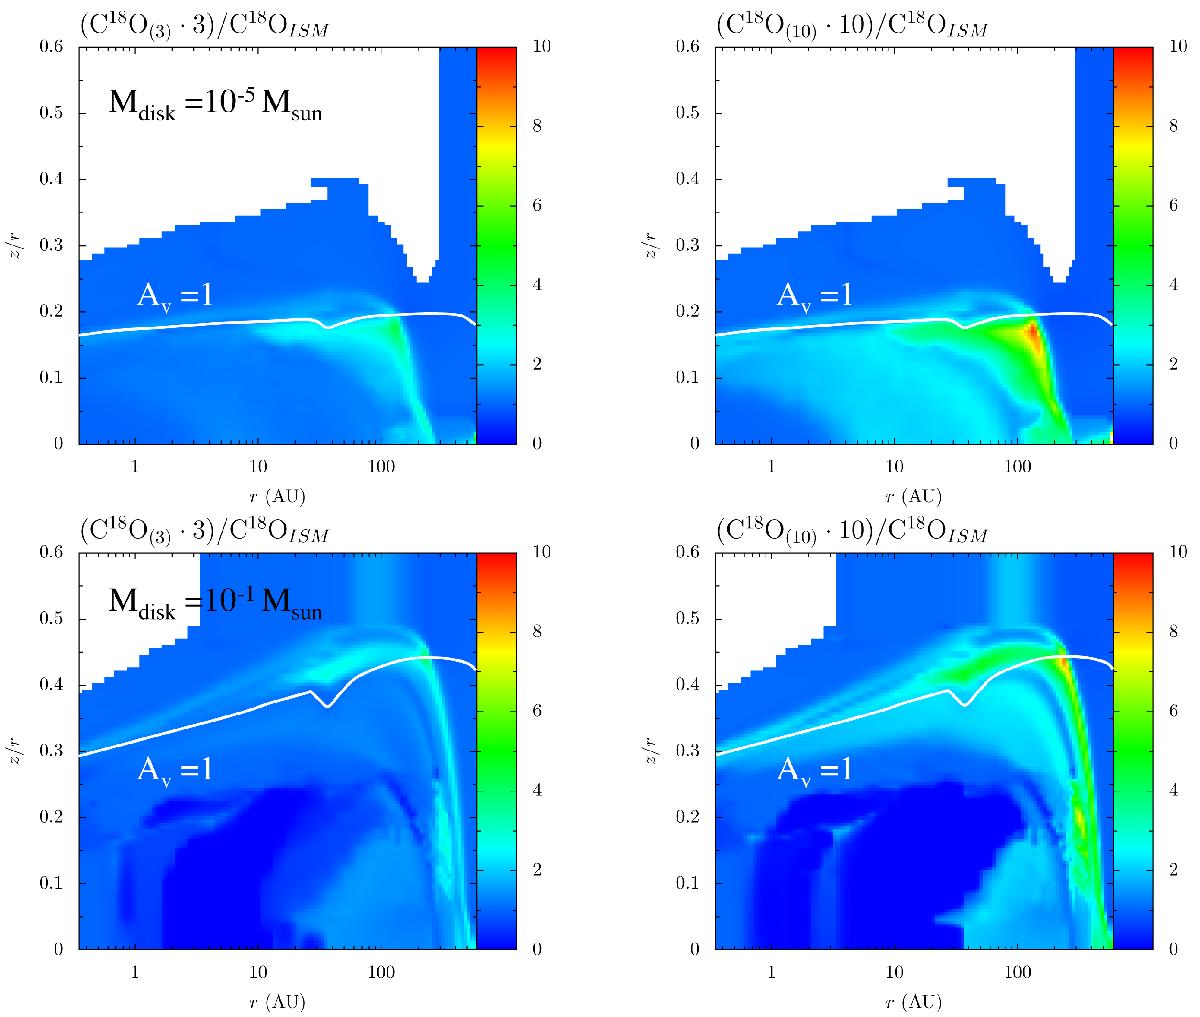
Ratios of C18O abundance obtained with a depleted level of carbon and with an ISM-like C abundance, rescaled by the level of carbon depletion. Where the ratio is higher than unity (colors from light blue to red), the C18O abundance changes more slowly than the elemental carbon abundance. Upper panels show a 10-5 M⊙ T Tauri disk model, bottom panels show a 10-1 M⊙ T Tauri disk model. Other disk parameters are: Rc = 60 au, γ = 0.8, hc = 0.1, and ψ = 0.1. The white solid line describes the AV = 1 surface, where photodissociating photons are mainly absorbed by the dust.
Current usage metrics show cumulative count of Article Views (full-text article views including HTML views, PDF and ePub downloads, according to the available data) and Abstracts Views on Vision4Press platform.
Data correspond to usage on the plateform after 2015. The current usage metrics is available 48-96 hours after online publication and is updated daily on week days.
Initial download of the metrics may take a while.