Fig. 2
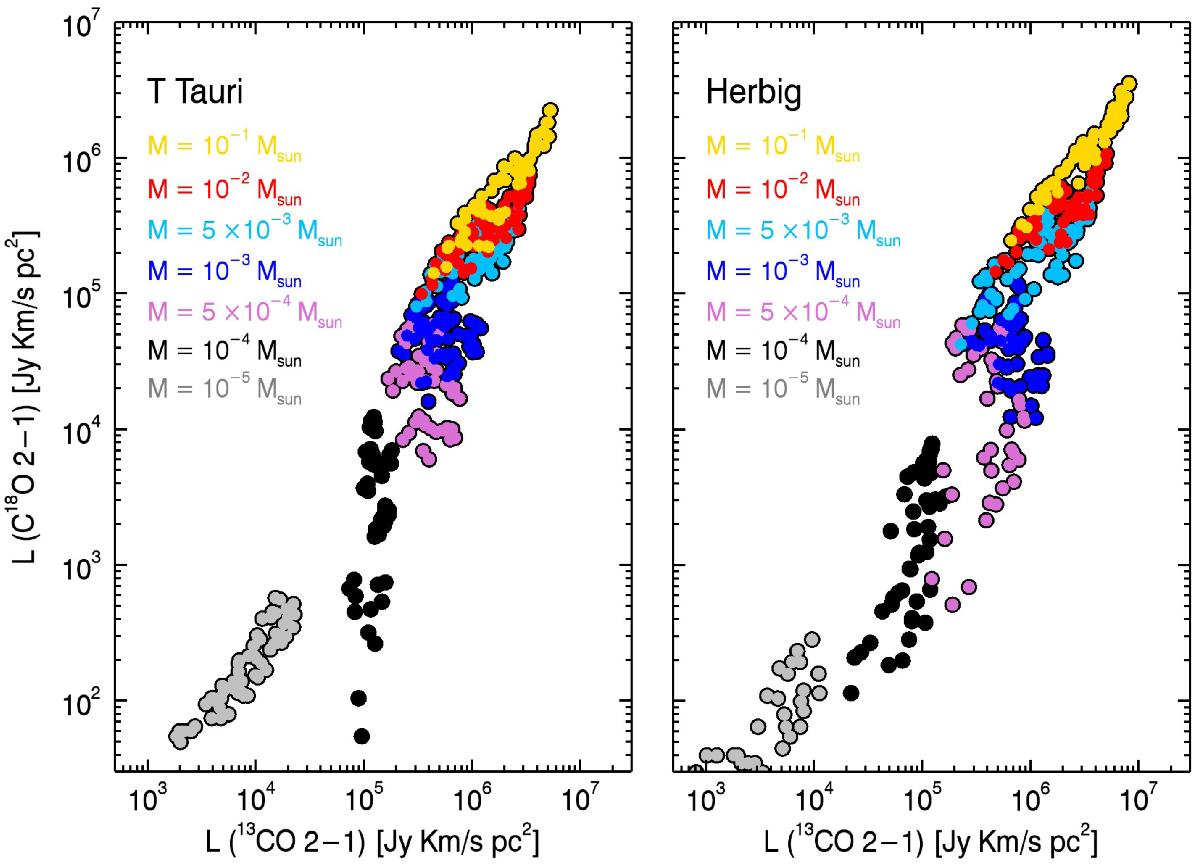
Line luminosity of C18O vs. 13CO (J = 2−1) obtained implementing isotope-selective processes. Different colors represent models with different disk gas masses. The scatter of the points is due to the exploration of various disk parameters (γ,Rc,ψ,hc, andi). Models shown in the left panel represent T Tauri disks, while those in the right panel represent Herbig disks, all located at a distance of 100 pc.
Current usage metrics show cumulative count of Article Views (full-text article views including HTML views, PDF and ePub downloads, according to the available data) and Abstracts Views on Vision4Press platform.
Data correspond to usage on the plateform after 2015. The current usage metrics is available 48-96 hours after online publication and is updated daily on week days.
Initial download of the metrics may take a while.